UNITED STATES SECURITIES AND EXCHANGE COMMISSION
Washington, D.C. 20549
_______________
Form 10-K
(Mark One)
|
☑ |
ANNUAL REPORT PURSUANT TO SECTION 13 OR 15(d) OF THE SECURITIES EXCHANGE ACT OF 1934 |
|
| For the fiscal year ended April 1, 2018 |
OR
|
☐ |
TRANSITION REPORT PURSUANT TO SECTION 13 OR 15(d) OF THE SECURITIES EXCHANGE ACT OF 1934 |
Commission File No. 1-7604
Crown Crafts, Inc.
(Exact name of registrant as specified in its charter)
|
Delaware |
58-0678148 |
|
(State of Incorporation) |
(I.R.S. Employer Identification No.) |
|
916 S. Burnside Ave. |
|
|
Gonzales, Louisiana |
70737 |
|
(Address of principal executive offices) |
(Zip Code) |
Registrant's Telephone Number, including area code: (225) 647-9100
Securities registered pursuant to Section 12(b) of the Act:
| Title of class | Name of exchange on which registered |
| Common Stock, $0.01 par value | The NASDAQ Capital Market |
Securities registered pursuant to Section 12(g) of the Act:
None
Indicate by check mark if the registrant is a well-known seasoned issuer, as defined in Rule 405 of the Securities Act. Yes ☐ No ☑
Indicate by check mark if the registrant is not required to file reports pursuant to Section 13 or Section 15(d) of the Securities Exchange Act. Yes ☐ No ☑
Indicate by check mark whether the registrant (1) has filed all reports required to be filed by Section 13 or 15(d) of the Securities Exchange Act of 1934 during the preceding 12 months (or for such shorter period that the registrant was required to file such reports), and (2) has been subject to such filing requirements for the past 90 days. Yes ☑ No ☐
Indicate by check mark whether the registrant has submitted electronically and posted on its corporate Website, if any, every Interactive Data File required to be submitted and posted pursuant to Rule 405 of Regulation S-T during the preceding 12 months (or for such shorter period that the registrant was required to submit and post such files). Yes ☑ No ☐
Indicate by check mark if disclosure of delinquent filers pursuant to Item 405 of Regulation S-K is not contained herein, and will not be contained, to the best of registrant's knowledge, in definitive proxy or information statements incorporated by reference in Part III of this Form 10-K or any amendment to this Form 10-K. ☑
Indicate by check mark whether the Registrant is a large accelerated filer, an accelerated filer, a non-accelerated filer, a smaller reporting company or an emerging growth company. See the definitions of “large accelerated filer,” “accelerated filer,” “smaller reporting company” and “emerging growth company” in Rule 12b-2 of the Exchange Act.
| Large accelerated filer | ☐ | Accelerated filer | ☑ |
| Non-Accelerated filer | ☐ (Do not check if a smaller reporting company) | Smaller Reporting Company | ☐ |
| Emerging Growth Company | ☐ |
If an emerging growth company, indicate by check mark if the registrant has elected not to use the extended transition period for complying with any new or revised financial accounting standards provided pursuant to Section 13(a) of the Exchange Act. ☐
Indicate by check mark whether the registrant is a shell company (as defined in Rule 12b-2 of the Exchange Act). Yes ☐ No ☑
The approximate aggregate market value of the voting stock held by non-affiliates of the registrant as of September 29, 2017 (the last business day of the registrant’s most recently completed second fiscal quarter) was $55.5 million.
As of May 10, 2018, 10,069,558 shares of the registrant’s common stock were outstanding.
Documents Incorporated by Reference:
Portions of the registrant’s Proxy Statement for its 2018 Annual Meeting of Stockholders are incorporated into Part III hereof by reference.
|
Page |
||
|
Item 1. |
3 |
|
|
Item 1A. |
6 |
|
|
Item 1B. |
11 |
|
|
Item 2. |
11 |
|
|
Item 3. |
11 |
|
|
Item 4. |
11 |
|
|
Item 5. |
12 |
|
|
Item 6. |
14 |
|
|
Item 7. |
Management’s Discussion and Analysis of Financial Condition and Results of Operations. |
15 |
|
Item 7A. |
21 |
|
|
Item 8. |
21 |
|
|
Item 9. |
Changes in and Disagreements With Accountants on Accounting and Financial Disclosure. |
21 |
|
Item 9A. |
22 |
|
|
Item 9B. |
22 |
|
|
Item 10. |
23 |
|
|
Item 11. |
23 |
|
|
Item 12. |
Security Ownership of Certain Beneficial Owners and Management and Related Stockholder Matters. |
23 |
|
Item 13. |
Certain Relationships and Related Transactions, and Director Independence. |
23 |
|
Item 14. |
23 |
|
|
Item 15. |
24 |
|
Cautionary Notice Regarding Forward-Looking Statements
Certain of the statements made herein under the caption “Management’s Discussion and Analysis of Financial Condition and Results of Operations,” and elsewhere, including information incorporated herein by reference to other documents, are “forward-looking statements” within the meaning of, and subject to the protections of, Section 27A of the Securities Act of 1933, as amended (the “Securities Act”), and Section 21E of the Securities Exchange Act of 1934, as amended (the “Exchange Act”). Forward-looking statements include statements with respect to our beliefs, plans, objectives, goals, expectations, anticipations, assumptions, estimates, intentions and future performance and involve known and unknown risks, uncertainties and other factors, many of which may be beyond our control and which may cause the actual results, performance or achievements of Crown Crafts, Inc. to be materially different from future results, performance or achievements expressed or implied by such forward-looking statements.
All statements other than statements of historical fact are statements that could be forward-looking statements. You can identify these forward-looking statements through our use of words such as “may,” “anticipate,” “assume,” “should,” “indicate,” “would,” “believe,” “contemplate,” “expect,” “estimate,” “continue,” “plan,” “point to,” “project,” “predict,” “could,” “intend,” “target,” “potential” and other similar words and expressions of the future. These forward-looking statements may not be realized due to a variety of factors, including, without limitation, those described in Part I, Item 1A. “Risk Factors,” and elsewhere in this report and those described from time to time in our future reports filed with the Securities and Exchange Commission (the “SEC”) under the Exchange Act.
All written or oral forward-looking statements that are made by or are attributable to us are expressly qualified in their entirety by this cautionary notice. Our forward-looking statements apply only as of the date of this report or the respective date of the document from which they are incorporated herein by reference. We have no obligation and do not undertake to update, revise or correct any of the forward-looking statements after the date of this report, or after the respective dates on which such statements otherwise are made, whether as a result of new information, future events or otherwise.
Description of Business
Crown Crafts, Inc. (the “Company”) was originally formed as a Georgia corporation in 1957. The Company was reincorporated as a Delaware corporation in 2003. The Company’s executive offices are located at 916 South Burnside Avenue, Gonzales, Louisiana 70737, its telephone number is (225) 647-9100 and its internet address is www.crowncrafts.com.
The Company operates indirectly through its wholly-owned subsidiaries, Hamco, Inc. (“Hamco”), Crown Crafts Infant Products, Inc. (“CCIP”) and Carousel Designs, LLC (“Carousel”), in the infant, toddler and juvenile products segment within the consumer products industry. The infant, toddler and juvenile products segment consists of infant and toddler bedding and blankets, bibs, soft bath products, disposable products, developmental toys and accessories. Sales of the Company’s products are generally made directly to retailers, which are primarily mass merchants, mid-tier retailers, juvenile specialty stores, value channel stores, grocery and drug stores, restaurants, wholesale clubs and internet-based retailers, as well as directly to consumers through www.babybedding.com. The Company’s products are marketed under a variety of Company-owned trademarks, under trademarks licensed from others and as private label goods.
The Company's fiscal year ends on the Sunday nearest to or on March 31. References herein to “fiscal year 2018” or “2018” represent the 52-week period ended April 1, 2018, “fiscal year 2017” or “2017” represent the 52-week period ended April 2, 2017, and references to “fiscal year 2016” or “2016” represent the 53-week period ended April 3, 2016.
The Company makes its annual reports on Form 10-K, quarterly reports on Form 10-Q, current reports on Form 8-K and amendments to those reports filed or furnished pursuant to Section 13(a) or 15(d) of the Exchange Act available free of charge on its website at www.crowncrafts.com as soon as reasonably practicable after such material has been electronically filed with the SEC. These reports are also available without charge on the SEC’s website at www.sec.gov.
Competition
The infant and toddler consumer products industry is highly competitive. The Company competes with a variety of distributors and manufacturers (both branded and private label), including large infant and juvenile product companies and specialty infant and juvenile product manufacturers, on the basis of quality, design, price, brand name recognition, service and packaging. The Company’s ability to compete depends principally on styling, price, service to the retailer and continued high regard for the Company’s products and trade names.
Trademarks, Copyrights and Patents
The Company considers its intellectual property to be of material importance to its business. Sales of products marketed under the Company’s trademarks, including NoJo®, Neat Solutions®, Carousel Designs® and Sassy®, accounted for 30%, 23%, and 23% of the Company’s total gross sales during fiscal years 2018, 2017 and 2016, respectively. Protection for these trademarks is obtained through domestic and foreign registrations. The Company also markets designs which are subject to copyrights and design patents owned by the Company.
International Sales
Sales to customers in countries other than the U.S. represented 3% of the Company’s total gross sales during each of fiscal years 2018, 2017 and 2016, which included 0.4% of sales to the customers set forth below that represented at least 10% of the Company’s gross sales during fiscal year 2018. International sales are based upon the location that predominately represents what the Company believes to be the final destination of the products delivered to the Company’s customers.
Products
The Company's primary focus is on infant, toddler and juvenile products, including the following:
|
● |
infant and toddler bedding |
|
● |
blankets and swaddle blankets |
|
● |
nursery and toddler accessories |
|
● |
room décor |
|
● |
reusable and disposable bibs |
|
● |
burp cloths |
|
● |
hooded bath towels and washcloths |
|
● |
reusable and disposable placemats and floor mats |
|
● |
disposable toilet seat covers and changing mats |
|
● |
developmental toys |
|
● |
feeding and care goods |
|
● |
other infant, toddler and juvenile soft goods |
Recent Acquisitions
Carousel: On August 4, 2017, Carousel Acquisition, LLC, a newly formed subsidiary of the Company, acquired substantially all of the assets and business, and assumed certain specified liabilities, of a privately held manufacturer and online retailer of premium infant and toddler bedding and nursery décor based in Douglasville, Georgia, which was at that time named Carousel Designs, LLC (the “Carousel Acquisition”). On August 11, 2017, the seller of such assets having relinquished its rights to its name as part of the terms of the acquisition transaction, Carousel Acquisition, LLC changed its name to Carousel Designs, LLC. To complete the Carousel Acquisition, Carousel paid $8.7 million from cash on hand and also paid off capital leases amounting to $845,000 that were associated with certain acquired fixed assets.
Sassy: On December 15, 2017, Hamco acquired certain assets associated with the Sassy®-branded developmental toy, feeding and baby care product line from Sassy 14, LLC and assumed certain related liabilities (the “Sassy Acquisition”). To complete the Sassy Acquisition, Hamco paid $6.5 million from a combination of cash on hand and the Company’s revolving line of credit.
Government Regulation and Environmental Control
The Company is subject to various federal, state and local environmental laws and regulations, which regulate, among other things, product safety and the discharge, storage, handling and disposal of a variety of substances and wastes, and to laws and regulations relating to employee safety and health, principally the Occupational Safety and Health Administration Act and regulations thereunder. The Company believes that it currently complies in all material respects with applicable environmental, health and safety laws and regulations and that future compliance with such existing laws or regulations will not have a material adverse effect on its capital expenditures, earnings or competitive position. However, there is no assurance that such requirements will not become more stringent in the future or that the Company will not have to incur significant costs to comply with such requirements.
Sales and Marketing
The Company’s products are marketed through a national sales force consisting of salaried sales executives and employees located in Compton, California; Gonzales, Louisiana; Grand Rapids, Michigan; and Bentonville, Arkansas. Products are also marketed by independent commissioned sales representatives located throughout the U.S. Substantially all products are sold to retailers for resale to consumers. The Company's subsidiaries introduce new products throughout the year and participate at the ABC Kids Expo.
Product Sourcing
Foreign and domestic contract manufacturers produce most of the Company’s products, with the largest concentration being in China. The Company makes sourcing decisions on the basis of quality, timeliness of delivery and price, including the impact of ocean freight and duties. Although the Company maintains relationships with a limited number of suppliers, the Company believes that its products may be readily manufactured by several alternative sources in quantities sufficient to meet the Company's requirements. The Company’s management and quality assurance personnel visit the third-party facilities regularly to monitor and audit product quality and to ensure compliance with labor requirements and social and environmental standards. In addition, the Company closely monitors the currency exchange rate. The impact of future fluctuations in the exchange rate or changes in safeguards cannot be predicted with certainty. The Company also produces some of its products domestically at a Company facility located in Douglasville, Georgia.
The Company maintains a foreign representative office located in Shanghai, China, which is responsible for the coordination of production, purchases and shipments, seeking out new vendors and overseeing inspections for social compliance and quality.
The Company’s products are warehoused and distributed from leased facilities located in Compton, California and Douglasville, Georgia.
Product Design and Styling
The Company believes that its creative team is one of its key strengths. The Company’s product designs are primarily created internally and are supplemented by numerous additional sources, including independent artists, decorative fabric manufacturers and apparel designers. Ideas for product design creations are drawn from various sources and are reviewed and modified by the design staff to ensure consistency within the Company’s existing product offerings and the themes and images associated with such existing products. In order to respond effectively to changing consumer preferences, the Company’s designers and stylists attempt to stay abreast of emerging lifestyle trends in color, fashion and design. When designing products under the Company’s various licensed brands, the Company’s designers coordinate their efforts with the licensors’ design teams to provide for a more fluid design approval process and to effectively incorporate the image of the licensed brand into the product. The Company’s designs include traditional, contemporary, textured and whimsical patterns across a broad spectrum of retail price points. Utilizing state of the art computer technology, the Company continually develops new designs throughout the year for all of its product groups. This continual development cycle affords the Company design flexibility, multiple opportunities to present new products to customers and the ability to provide timely responses to customer demands and changing market trends. The Company also creates designs for exclusive sale by certain of its customers under the Company’s brands, as well as the customers’ private label brands.
Employees
At May 10, 2018, the Company had 179 employees, none of whom is represented by a labor union or is otherwise a party to a collective bargaining agreement. The Company attracts and maintains qualified personnel by paying competitive salaries and benefits and offering opportunities for advancement. The Company considers its relationship with its employees to be good.
Customers
The Company's customers consist principally of mass merchants, mid-tier retailers, juvenile specialty stores, value channel stores, grocery and drug stores, restaurants, internet accounts and wholesale clubs. The Company does not enter into long-term or other purchase agreements with its customers. The table below sets forth those customers that represented at least 10% of the Company’s gross sales in fiscal years 2018, 2017, and 2016.
| Fiscal Year | |||||
|
|
2018 |
2017 |
2016 |
||
|
Walmart Inc. |
39% |
42% |
42% |
||
|
Toys "R" Us, Inc. |
15% |
19% |
23% |
||
|
Amazon.com, Inc. |
11% |
* |
* |
||
|
* Amount represented less than 10% of the Company's gross sales for this fiscal year. |
|||||
Licensed Products
Certain products are manufactured and sold pursuant to licensing agreements for trademarks. Also, many of the designs used by the Company are copyrighted by other parties, including trademark licensors, and are available to the Company through copyright license agreements. The licensing agreements are generally for an initial term of one to three years and may or may not be subject to renewal or extension. Sales of licensed products represented 52% of the Company’s gross sales in fiscal year 2018, which included 34% of sales under the Company's license agreements with affiliated companies of The Walt Disney Company (“Disney”), which expire as set forth below:
|
License Agreement |
Expiration |
|
Infant Bedding and Décor |
December 31, 2018 |
|
Infant Feeding and Bath |
December 31, 2019 |
|
Toddler Bedding |
December 31, 2019 |
Seasonality and Inventory Management
There are no significant variations in the seasonal demand for the Company’s products from year to year. Sales are generally higher in periods when customers take initial shipments of new products, as these orders typically include enough products for initial sets for each store and additional quantities for the customer’s distribution centers. The timing of these initial shipments varies by customer and depends on when the customer finalizes store layouts for the upcoming year and whether the customer has any mid-year introductions of products. Sales may also be higher or lower, as the case may be, in periods when customers are restricting internal inventory levels. Consistent with the expected introduction of specific product offerings, the Company carries necessary levels of inventory to meet the anticipated delivery requirements of its customers. Customer returns of merchandise shipped are historically less than 1% of gross sales.
The following risk factors as well as the other information contained in this report and other filings made by the Company with the SEC should be considered in evaluating the Company’s business. Additional risks and uncertainties not presently known to us or that we currently consider immaterial may also impair our business operations. If any of the following risks actually occur, operating results may be affected in future periods.
The loss of one or more of the Company’s key customers could result in a material loss of revenues.
The Company’s top three customers represented approximately 65% of gross sales in fiscal year 2018, which included 15% of sales to Toys “R” Us-Delaware, Inc. (“Toys-Delaware”), an affiliated company of Toys “R” Us, Inc. (“TRU”). On September 18, 2017, TRU and Toys-Delaware filed petitions for relief under Chapter 11 of the U.S. Bankruptcy Code with the U.S. Bankruptcy Court for the Eastern District of Virginia. On March 14, 2018, TRU filed a motion with the Court seeking authority to close all of the remaining Toys-Delaware stores and distribution centers in the U.S., and to otherwise liquidate and wind-down all operations of Toys-Delaware. The Company had ceased all shipments to Toys-Delaware shortly before the liquidation filing was made. The Company anticipates that the loss of future business with Toys-Delaware may be mitigated by a shift to the Company’s other customers.
Although the Company does not enter into contracts with its key customers, it expects its key customers (with the exception of Toys-Delaware) to continue to be a significant portion of its gross sales in the future. The loss of, or a decline in orders from, either or both of the Company’s two remaining top customers could result in a material decrease in the Company’s revenue and operating income.
The loss of one or more of the Company’s licenses could result in a material loss of revenues.
Sales of licensed products represented 52% of the Company’s gross sales in fiscal year 2018, which included 34% of sales associated with the Company’s license agreements with Disney. The Company could experience a material loss of revenues if it is unable to renew its major license agreements or obtain new licenses. The volume of sales of licensed products is inherently tied to the success of the characters, films and other licensed programs of the Company’s licensors. A decline in the popularity of these licensed programs or the inability of the licensors to develop new properties for licensing could also result in a material loss of revenues to the Company. Additionally, the Company’s license agreements with Disney and others require a material amount of minimum guaranteed royalty payments. The failure by the Company to achieve the sales envisioned by the license agreements could result in the payment by the Company of shortfalls in the minimum guaranteed royalty payments, which would adversely impact the Company’s operating results.
The Company’s business is impacted by general economic conditions and related uncertainties affecting markets in which the Company operates.
The Company’s growth is largely dependent upon growth in the birthrate, and in particular, the rate of first births. Economic conditions, including the real and perceived threat of a recession, could lead individuals to decide to forgo or delay having children. Even under optimal economic conditions, shifts in demographic trends and preferences could have the consequence of individuals starting to have children later in life and/or having fewer children. These conditions could result in reduced demand for some of the Company’s products, increased order cancellations and returns, an increased risk of excess and obsolete inventories and increased pressure on the prices of the Company’s products. Also, although the Company’s use of a commercial factor significantly reduces the risk associated with collecting accounts receivable, the factor may at any time terminate or limit its approval of shipments to a particular customer, and the likelihood of the factor doing so may increase due to a change in economic conditions. Such an action by the factor could result in the loss of future sales to the affected customer.
The Company’s success is dependent upon retaining key management personnel.
Certain of the Company’s executive management and other key personnel have been integral to the Company’s operations and the execution of its growth strategy. The departure from the Company of one or more of these individuals, along with the inability of the Company to attract qualified and suitable individuals to fill the Company’s open positions, could adversely impact the Company’s growth and operating results.
The Company may need to write down or write off inventory.
If product programs end before the inventory is completely sold, then the remaining inventory may have to be sold at less than carrying value. The market value of certain inventory items could drop to below carrying value after a decline in sales, at the end of programs, or when management makes the decision to exit a product group. Such inventory would then need to be written down to the lower of carrying or market value, or possibly completely written off, which would adversely affect the Company’s operating results.
Recalls or product liability claims could increase costs or reduce sales.
The Company must comply with the Consumer Product Safety Improvement Act, which imposes strict standards to protect children from potentially harmful products and which requires that the Company’s products be tested to ensure that they are within acceptable levels for lead and phthalates. The Company must also comply with related regulations developed by the Consumer Product Safety Commission and similar state regulatory authorities. The Company’s products could be subject to involuntary recalls and other actions by these authorities, and concerns about product safety may lead the Company to voluntarily recall, accept returns or discontinue the sale of select products. Product liability claims could exceed or fall outside the scope of the Company’s insurance coverage. Recalls or product liability claims could result in decreased consumer demand for the Company’s products, damage to the Company’s reputation, a diversion of management’s attention from its business and increased customer service and support costs, any or all of which could adversely affect the Company’s operating results.
The strength of the Company’s competitors may impact the Company’s ability to maintain and grow its sales, which could decrease the Company’s revenues.
The infant and toddler consumer products industry is highly competitive. The Company competes with a variety of distributors and manufacturers, both branded and private label. The Company’s ability to compete successfully depends principally on styling, price, service to the retailer and continued high regard for the Company’s products and trade names. Several of these competitors are larger than the Company and have greater financial resources than the Company, and some have experienced financial challenges from time to time, including servicing significant levels of debt. Those facing financial pressures could choose to make particularly aggressive pricing decisions in an attempt to increase revenue. The effects of increased competition could result in a material decrease in the Company’s revenues.
The Company’s ability to identify, consummate and integrate acquisitions, divestitures and other significant transactions successfully could have an adverse impact on the Company’s financial results, business and prospects.
As part of its business strategy, the Company has made acquisitions of businesses, divestitures of businesses and assets, and has entered into other transactions to further the interests of the Company’s business and its stockholders. Risks associated with such activities include the following, any of which could adversely affect the Company’s financial results:
|
● |
The active management of acquisitions, divestitures and other significant transactions requires varying levels of Company resources, including the efforts of the Company’s key management personnel, which could divert attention from the Company’s ongoing business operations. |
|
● |
The Company may not fully realize the anticipated benefits and expected synergies of any particular acquisition or investment, or may experience a prolonged timeframe for realizing such benefits and synergies. |
|
● |
Increased or unexpected costs, unanticipated delays or failure to meet contractual obligations could make acquisitions and investments less profitable or unprofitable. |
The Company’s ability to comply with its credit facility is subject to future performance and other factors.
The Company’s ability to make required payments of principal and interest on its debts, to refinance its maturing indebtedness, to fund capital expenditures or to comply with its debt covenants will depend upon future performance. The Company’s future performance is, to a certain extent, subject to general economic, financial, competitive, legislative, regulatory and other factors beyond its control. The breach of any of the debt covenants could result in a default under the Company’s credit facility. Upon the occurrence of an event of default, the Company’s lender could make an immediate demand of the amount outstanding under the credit facility. If a default was to occur and such a demand was to be made, there can be no assurance that the Company’s assets would be sufficient to repay the indebtedness in full.
The Company’s debt covenants may affect its liquidity or limit its ability to pursue acquisitions, incur debt, make investments, sell assets or complete other significant transactions.
The Company’s credit facility contains usual and customary covenants regarding significant transactions, including restrictions on other indebtedness, liens, transfers of assets, investments and acquisitions, merger or consolidation transactions, transactions with affiliates and changes in or amendments to the organizational documents for the Company and its subsidiaries. Unless waived by the Company’s lender, these covenants could limit the Company’s ability to pursue opportunities to expand its business operations, respond to changes in business and economic conditions and obtain additional financing, or otherwise engage in transactions that the Company considers beneficial.
The Company’s inability to anticipate and respond to consumers’ tastes and preferences could adversely affect the Company’s revenues.
Sales are driven by consumer demand for the Company’s products. There can be no assurance that the demand for the Company’s products will not decline or that the Company will be able to anticipate and respond to changes in demand. The Company’s failure to adapt to these changes could lead to lower sales and excess inventory, which could have a material adverse effect on the Company’s financial condition and operating results.
Customer pricing pressures could result in lower selling prices, which could negatively affect the Company’s operating results.
The Company’s customers could place pressure on the Company to reduce the prices of its products. The Company continuously strives to stay ahead of its competition in sourcing, which allows the Company to obtain lower cost products while maintaining high standards for quality. There can be no assurance that the Company could respond to a decrease in sales prices by proportionately reducing its costs, which could adversely affect the Company’s operating results.
Changes in international trade regulations and other risks associated with foreign trade could adversely affect the Company’s sourcing.
The Company sources its products primarily from foreign contract manufacturers, with the largest concentration being in China. Difficulties encountered by these suppliers, such as the instability inherent in operating within an authoritarian political structure, could halt or disrupt production of the Company’s products. The Chinese government could make allegations against the Company of corruption or antitrust violations, or could adopt regulations related to the manufacture of products within China, including quotas, duties, taxes and other charges or restrictions on the exportation of goods produced in China. Alternatively, the U.S. government could impose similar actions on the importation of goods manufactured in China. Any of these actions could result in an increase in the cost of the Company’s products. Also, an arbitrary strengthening of the Chinese currency versus the U.S. Dollar could increase the prices at which the Company purchases finished goods. Any event causing a disruption of the flow of products manufactured on behalf of the Company, whether within the Chinese interior or at the point of embarkation, could result in delays in the receipt of the Company’s inventory and an increase in the cost of the Company’s products. In addition, changes in U.S. customs procedures or delays in the clearance of goods through customs could result in the Company being unable to deliver goods to customers in a timely manner or the potential loss of sales altogether. The occurrence of any of these events could adversely affect the Company’s profitability.
A significant disruption to the Company’s distribution network or to the timely receipt of inventory could adversely impact sales or increase transportation costs, which would decrease the Company’s profits.
Nearly all of the Company’s products are imported from China into the Port of Long Beach in southern California. There are many links in the distribution chain, including the availability of ocean freight, cranes, dockworkers, containers, tractors, chassis and drivers. The timely receipt of the Company’s products is also dependent upon efficient operations at the Port of Long Beach. Any shortages in the availability of any of these links or disruptions in port operations, including strikes, lockouts or other work stoppages or slowdowns, could cause bottlenecks and other congestion in the distribution network, which could adversely impact the Company’s ability to obtain adequate inventory on a timely basis and result in lost sales, increased transportation costs and an overall decrease of the Company’s profits.
Disruptions to the Company’s information technology systems could negatively affect the Company’s results of operations.
The Company’s operations are highly dependent upon computer hardware and software systems, including customized information technology systems and cloud-based applications. The importance of data management and technology to the Company is analogous to the importance of electricity in the past century. The Company also employs third-party systems and software that are integral to its operations. These systems are vulnerable to cybersecurity incidents, including disruptions and security breaches, which can result from unintentional events or deliberate attacks by insiders or third parties, such as cybercriminals, competitors, nation-states, computer hackers and other cyber terrorists. The Company faces an evolving landscape of cybersecurity threats in which evildoers use a complex array of means to perpetrate attacks, including the use of stolen access credentials, malware, ransomware, phishing, structured query language injection attacks and distributed denial-of-service attacks. The Company has implemented security measures to securely maintain confidential and proprietary information stored on the Company’s information systems and continually invests in maintaining and upgrading the systems and applications to mitigate these risks. There can be no assurance that these measures and technology will adequately prevent an intrusion or that a third party that is relied upon by the Company will not suffer an intrusion, that unauthorized individuals will not gain access to confidential or proprietary information or that any such incident will be timely detected and effectively countered. A significant data security breach could result in a disruption to the Company’s operations and could adversely impact its results of operations.
The Company’s sourcing and marketing operations in foreign countries are subject to anti-corruption laws.
The Company’s foreign operations are subject to laws prohibiting improper payments and bribery, including the U.S. Foreign Corrupt Practices Act and similar laws and regulations in foreign jurisdictions, which apply to the Company’s directors, officers, employees and agents acting on behalf of the Company. Failure to comply with these laws could result in damage to the Company’s reputation, a diversion of management’s attention from its business, increased legal and investigative costs, and civil and criminal penalties, any or all of which could adversely affect the Company’s operating results.
The Company could experience adjustments to its effective tax rate or its prior tax obligations, either of which could adversely affect its results of operations.
The Company is subject to income taxes in the many jurisdictions in which it operates, including the U.S., several U.S. states and China. At any particular point in time, several tax years are subject to general examination or other adjustment by these various jurisdictions. In December 2016, the Company received notification from the State of California of its intention to examine the Company’s consolidated income tax returns for the fiscal years ended April 3, 2011, April 1, 2012, March 31, 2013 and March 30, 2014. The ultimate resolution of the examination could include administrative or legal proceedings. Although the Company believes that the calculations and positions taken on its original and amended filed returns are reasonable and justifiable, negotiations or litigation leading to the final outcome of any examination or claim for refund could result in an adjustment to the position that the Company has taken. Such adjustment could result in further adjustment to one or more income tax returns for other jurisdictions, or to income tax returns for prior or subsequent tax years, or both. To the extent that the Company’s reserve for unrecognized tax benefits is not adequate to support the cumulative effect of such adjustments, the Company could experience a material adverse impact on operating results.
The Company’s provision for income taxes is based on its effective tax rate, which in any given financial statement period could fluctuate based on changes in tax laws or regulations, changes in the mix and level of earnings by taxing jurisdiction, changes in the amount of certain expenses within the consolidated statements of income that will never be deductible on the Company’s income tax returns and certain charges deducted on the Company’s income tax returns that are not included within the consolidated statements of income. These changes could cause fluctuations in the Company’s effective tax rate either on an absolute basis, or in relation to varying levels of the Company’s pre-tax income. Such fluctuations in the Company’s effective tax rate could adversely affect its results of operations.
On December 22, 2017, the President of the United States signed into law comprehensive tax legislation commonly referred to as the Tax Cuts and Jobs Act (the “TCJA”), which includes a provision to lower the federal corporate income tax rate to 21% effective as of January 1, 2018. The final impact of the TCJA on the Company may differ from the Company’s estimates, possibly materially, due to such factors as changes in interpretations and assumptions made, related regulations or other guidance that may be issued, and actions taken by the Company in response to the enactment of the TCJA.
The Company could experience losses associated with its intellectual property.
The Company relies upon the fair interpretation and enforcement of patent, copyright, trademark and trade secret laws in the U.S., similar laws in other countries, and agreements with employees, customers, suppliers, licensors and other parties. Such reliance serves to establish and maintain the intellectual property rights associated with the products that the Company develops and sells. However, the laws and courts of certain countries at times do not protect intellectual property rights or respect contractual agreements to the same extent as the laws of the U.S. Therefore, in certain jurisdictions the Company may not be able to protect its intellectual property rights against counterfeiting or enforce its contractual agreements with other parties. In addition, another party could claim that the Company is infringing upon such party’s intellectual property rights, and claims of this type could lead to a civil complaint.
An unfavorable outcome in litigation involving intellectual property could result in any or all of the following: (i) civil judgments against the Company, which could require the payment of royalties on both past and future sales of certain products, as well as plaintiff’s attorneys’ fees and other litigation costs; (ii) impairment charges of up to the carrying value of the Company’s intellectual property rights; (iii) restrictions on the ability of the Company to sell certain of its products; (iv) legal and other costs associated with investigations and litigation; and (v) the Company’s competitive position could be adversely affected.
Economic conditions could result in an increase in the amounts paid for the Company’s products.
Significant increases in the price of raw materials that are components of the Company’s products, including cotton, oil and labor, could adversely affect the amounts that the Company must pay its suppliers for its finished goods. If the Company is unable to pass these cost increases along to its customers, its profitability could be adversely affected.
Government regulation of the Internet and e-commerce is evolving, and unfavorable changes or failure by the Company to adequately comply with new laws and regulations could substantially harm its results of operations.
The Company is subject to laws and regulations governing the Internet and e-commerce. The U.S. Supreme Court is currently deliberating the constitutionality of some of these laws. These regulations and laws include requirements to potentially collect and remit sales tax on orders of the Company’s products that are made through the Internet and are subsequently shipped to customers in thousands of jurisdictions throughout the U.S. within which the Company does not have a routine physical presence. These laws and regulations are often subject to interpretation and application in a manner that is inconsistent from one jurisdiction to another. The Company cannot assure that its practices have complied, are currently complying, or will comply fully and adequately with all such laws and regulations. Any failure to comply with any of these laws or regulations could result in damage to the Company’s reputation or a loss or reduction of orders. If the Company does fully comply with such laws and regulations, its customers could immediately see a significant increase in the total order cost of the Company’s products as such taxes are imposed, which will make the pricing of the Company’s products less competitive. Compliance with such laws and regulations will require a significant investment and continuing costs, as well as efforts of the Company’s key management personnel. Also, the Company at any time could be subjected to examinations by any of the jurisdictions into which the Company may have at one time or another shipped its products, which could result in the assessment upon the Company of a significant accumulation of uncollected taxes, along with penalties and interest. The occurrence of any of these events could adversely affect the Company’s financial position and operating results.
A stockholder could lose all or a portion of his or her investment in the Company.
The Company’s common stock has historically experienced a degree of price variability, and the price could be subject to rapid and substantial fluctuations. The Company’s common stock has also historically been thinly traded, a circumstance that exists when there is a relatively small volume of buy and sell orders for the Company’s common stock at any given point in time. In such situations, a stockholder may be unable to liquidate his or her position in the Company’s common stock at the desired price. Also, as an equity investment, a stockholder’s investment in the Company is subordinate to the interests of the Company’s creditors, and a stockholder could lose all or a substantial portion of his or her investment in the Company in the event of a voluntary or involuntary bankruptcy filing or liquidation.
ITEM 1B. Unresolved Staff Comments
None.
The Company's headquarters are located in Gonzales, Louisiana. The Company rents 17,761 square feet at this location under a lease that expires January 31, 2021. Management believes that its properties are suitable for the purposes for which they are used, are in generally good condition and provide adequate capacity for current and anticipated future operations. The table below sets forth certain information regarding the Company's principal real property as of May 10, 2018.
|
Location |
Use |
Approximate Square Feet |
Owned/ Leased |
|
Gonzales, Louisiana |
Administrative and sales office |
17,761 |
Leased |
|
Compton, California |
Offices, warehouse and distribution center |
157,400 |
Leased |
|
Douglasville, Georgia |
Offices, manufacturing and warehouse |
23,800 |
Leased |
|
Grand Rapids, Michigan |
Product design offices |
3,600 |
Leased |
|
Bentonville, Arkansas |
Sales office |
1,376 |
Leased |
|
Shanghai, People’s Republic of China |
Office |
1,912 |
Leased |
The Company is, from time to time, involved in various legal proceedings relating to claims arising in the ordinary course of its business. Neither the Company nor any of its subsidiaries is a party to any such legal proceeding the outcome of which, individually or in the aggregate, is expected to have a material adverse effect on the Company’s financial position, results of operations or cash flows.
ITEM 4. Mine Safety Disclosures
Not applicable.
ITEM 5. Market for Registrant's Common Equity, Related Stockholder Matters and Issuer Purchases of Equity Securities
Description of Securities
The Company is authorized to issue up to 40,000,000 shares of capital stock, all of which are classified as common stock with a par value of $0.01 per share. On May 10, 2018, there were 12,493,789 shares of the Company’s common stock issued, 10,069,558 of which were outstanding.
Market Information and Price
The Company's common stock is traded on the NASDAQ Capital Market under the symbol “CRWS”. On May 10, 2018, the closing price of the Company’s common stock was $5.85 per share. The table below sets forth the high and low closing price per share of the Company's common stock and the cash dividends per share declared on the Company’s common stock during each quarter of fiscal years 2018 and 2017.
|
|
Closing Price |
Cash Dividends |
||||||||||
|
Quarter |
High | Low | Declared | |||||||||
| Fiscal Year 2018 | ||||||||||||
|
First Quarter |
$ | 8.10 | $ | 6.70 | $ | 0.08 | ||||||
|
Second Quarter |
7.15 | 5.40 | 0.08 | |||||||||
|
Third Quarter |
6.64 | 5.75 | 0.08 | |||||||||
|
Fourth Quarter |
7.45 | 5.90 | 0.08 | |||||||||
|
Fiscal Year 2017 |
||||||||||||
|
First Quarter |
$ | 9.80 | $ | 9.11 | $ | 0.08 | ||||||
|
Second Quarter |
10.20 | 9.66 | 0.08 | |||||||||
|
Third Quarter |
10.24 | 7.60 | 0.48 | |||||||||
|
Fourth Quarter |
8.65 | 7.25 | 0.08 | |||||||||
Holders of Common Stock
As of May 10, 2018, there were approximately 170 registered holders of the Company’s common stock.
Dividends
The Company’s credit facility permits the Company to pay cash dividends on its common stock without limitation, provided there is no default under the credit facility before or as a result of the payment of such dividends.
Securities Authorized for Issuance under Equity Compensation Plans
Refer to “Securities Authorized for Issuance under Equity Compensation Plans” in Item 12. of Part III of this Annual Report on Form 10-K.
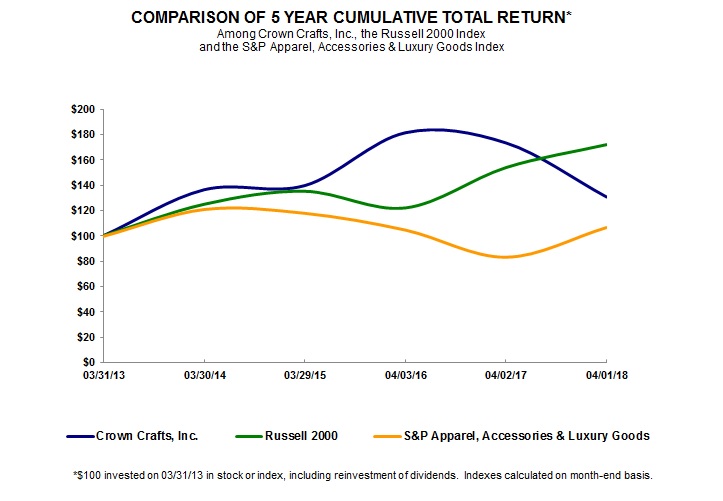
Performance Graph
The following graph (the “Performance Graph”) compares the Company’s cumulative total stockholder return on its common stock for the five-year period ended April 1, 2018 with the cumulative total returns of the Russell 2000 Index and the S&P Apparel, Accessories & Luxury Goods Index for the same period. The Performance Graph tracks the performance of separate $100 investments in the Company’s common stock and the indices on March 31, 2013 through April 1, 2018, with the reinvestment of all dividends.
|
03/31/13 |
03/30/14 |
03/29/15 |
04/03/16 |
04/02/17 |
04/01/18 |
|||||||||||||||||||
|
Crown Crafts, Inc. |
100.00 | 136.37 | 139.66 | 181.51 | 173.47 | 130.62 | ||||||||||||||||||
|
Russell 2000 Index |
100.00 | 124.90 | 135.15 | 121.96 | 153.94 | 172.09 | ||||||||||||||||||
|
S&P Apparel, Accessories & Luxury Goods Index |
100.00 | 121.26 | 118.19 | 104.93 | 83.37 | 106.94 | ||||||||||||||||||
The comparisons in the Performance Graph are based on historical data and are not indicative of, or intended to forecast, the future performance of the Company’s common stock. The Performance Graph will not be deemed to be incorporated by reference into any filing under the Securities Act or the Exchange Act, except to the extent that the Company specifically incorporates the Performance Graph by reference. In addition, the Performance graph will not be deemed to be soliciting material or to be filed with the SEC or subject to Regulation 14A or 14C, other than as provided in Regulation S-K, or to the liabilities of Section 18 of the Exchange Act, except to the extent that the Company specifically requests that the Performance Graph be treated as soliciting material or specifically incorporates it by reference into a filing under the Securities Act or the Exchange Act.
ITEM 6. Selected Financial Data
The information set forth below is not necessarily indicative of the Company’s future financial position or operating results and should be read in conjunction with Item 7. “Management’s Discussion and Analysis of Financial Condition and Results of Operations” and the consolidated financial statements and notes thereto included in this Annual Report on Form 10-K.
|
Fiscal Years |
||||||||||||||||||||
|
2018 |
2017 |
2016 |
2015 |
2014 |
||||||||||||||||
|
|
(amounts in thousands, except per share amounts) |
|||||||||||||||||||
| Operating results: | ||||||||||||||||||||
|
Net sales |
$ | 70,270 | $ | 65,978 | $ | 84,342 | $ | 85,978 | $ | 81,294 | ||||||||||
|
Gross profit |
19,779 | 19,411 | 23,813 | 23,550 | 22,534 | |||||||||||||||
|
Gross profit percentage |
28.1 | % | 29.4 | % | 28.2 | % | 27.4 | % | 27.7 | % | ||||||||||
|
Income from operations |
5,507 | 8,700 | 10,788 | 9,220 | 9,378 | |||||||||||||||
|
Income before income tax expense |
5,421 | 8,796 | 10,744 | 9,160 | 9,346 | |||||||||||||||
|
Income tax expense |
2,400 | 3,224 | 3,915 | 3,442 | 3,575 | |||||||||||||||
|
Net income |
3,021 | 5,572 | 6,829 | 5,718 | 5,771 | |||||||||||||||
|
Basic earnings per share |
$ | 0.30 | $ | 0.56 | $ | 0.68 | $ | 0.57 | $ | 0.59 | ||||||||||
|
Diluted earnings per share |
$ | 0.30 | $ | 0.55 | $ | 0.68 | $ | 0.57 | $ | 0.59 | ||||||||||
|
Cash dividends declared per share |
$ | 0.32 | $ | 0.72 | $ | 0.57 | $ | 0.32 | $ | 0.32 | ||||||||||
|
Financial position at year-end: |
||||||||||||||||||||
|
Cash and cash equivalents |
$ | 215 | $ | 7,892 | $ | 7,574 | $ | 1,807 | $ | 560 | ||||||||||
|
Accounts receivable, net of allowances |
18,498 | 15,614 | 20,796 | 22,370 | 21,712 | |||||||||||||||
|
Inventories |
19,788 | 15,821 | 14,785 | 15,468 | 13,607 | |||||||||||||||
|
Total current assets |
39,754 | 41,110 | 45,732 | 42,519 | 38,069 | |||||||||||||||
|
Finite-lived intangible assets - net |
7,272 | 3,128 | 3,882 | 4,507 | 5,248 | |||||||||||||||
|
Goodwill |
7,125 | 1,126 | 1,126 | 1,126 | 1,126 | |||||||||||||||
|
Total assets |
56,581 | 47,184 | 52,415 | 49,946 | 46,215 | |||||||||||||||
|
Total current liabilities |
6,788 | 7,573 | 12,185 | 10,374 | 10,298 | |||||||||||||||
|
Long-term debt |
9,458 | - | - | - | - | |||||||||||||||
|
Shareholders’ equity |
39,318 | 38,923 | 40,019 | 39,572 | 35,917 | |||||||||||||||
|
Total liabilities and shareholders’ equity |
$ | 56,581 | $ | 47,184 | $ | 52,415 | $ | 49,946 | $ | 46,215 | ||||||||||
ITEM 7. Management's Discussion and Analysis of Financial Condition and Results of Operations
The following discussion is intended to provide information concerning certain factors that management considers important in reviewing the Company’s results of operations, financial position, liquidity and capital resources. This discussion should be read in conjunction with the consolidated financial statements and notes thereto included elsewhere in this Annual Report on Form 10-K.
Results of Operations
The following table contains results of operations for fiscal years 2018, 2017 and 2016 and the dollar and percentage changes for those periods (in thousands, except percentages).
|
2017 to 2018 Change |
2016 to 2017 Change |
|||||||||||||||||||||||||||
|
2018 |
$ |
% |
2017 |
$ |
% |
2016 |
||||||||||||||||||||||
|
Net sales by category: |
||||||||||||||||||||||||||||
|
Bedding, blankets and accessories |
$ | 43,486 | $ | 1,105 | 2.6 | % | $ | 42,381 | $ | (16,639 | ) | -28.2 | % | $ | 59,020 | |||||||||||||
|
Bibs, bath, developmental toy, feeding, baby care and disposable products |
26,784 | 3,187 | 13.5 | % | 23,597 | (1,725 | ) | -6.8 | % | 25,322 | ||||||||||||||||||
|
Total net sales |
70,270 | 4,292 | 6.5 | % | 65,978 | (18,364 | ) | -21.8 | % | 84,342 | ||||||||||||||||||
|
Cost of products sold |
50,491 | 3,924 | 8.4 | % | 46,567 | (13,962 | ) | -23.1 | % | 60,529 | ||||||||||||||||||
|
Gross profit |
19,779 | 368 | 1.9 | % | 19,411 | (4,402 | ) | -18.5 | % | 23,813 | ||||||||||||||||||
|
% of net sales |
28.1 | % | 29.4 | % | 28.2 | % | ||||||||||||||||||||||
|
Marketing and administrative expenses |
14,272 | 3,561 | 33.2 | % | 10,711 | (2,314 | ) | -17.8 | % | 13,025 | ||||||||||||||||||
|
% of net sales |
20.3 | % | 16.2 | % | 15.4 | % | ||||||||||||||||||||||
|
Interest expense |
162 | 94 | 138.2 | % | 68 | 10 | 17.2 | % | 58 | |||||||||||||||||||
|
Other income |
76 | (88 | ) | -53.7 | % | 164 | 150 | 1071.4 | % | 14 | ||||||||||||||||||
|
Income tax expense |
2,400 | (824 | ) | -25.6 | % | 3,224 | (691 | ) | -17.7 | % | 3,915 | |||||||||||||||||
|
Net income |
3,021 | (2,551 | ) | -45.8 | % | 5,572 | (1,257 | ) | -18.4 | % | 6,829 | |||||||||||||||||
|
% of net sales |
4.3 | % | 8.4 | % | 8.1 | % | ||||||||||||||||||||||
Net Sales:
Fiscal 2018 Compared with Fiscal 2017
Sales of $70.3 million for 2018 were $4.3 million higher than 2017, an increase of 6.5%. The increase is due to sales that resulted from the Carousel Acquisition and the Sassy Acquisition, which added $5.4 million and $2.1 million of sales during fiscal 2018, respectively, and which amount was offset by a decrease of $4.3 million in sales by CCIP for the same period. A portion of the decrease resulted from reduced product shipments in the current year to a customer that experienced credit problems throughout the year. Also affecting sales is the continuing change in the infant bedding marketplace in which parents are purchasing fewer bedding sets in favor of separates, leading to a lower average price point for the Company’s infant bedding products.
Fiscal 2017 Compared with Fiscal 2016
Sales of $66.0 million for 2017 were lower than 2016, having decreased 21.8%, or $18.4 million. A portion of the sales decrease was due to a Black Friday promotion in 2016 that was not repeated in fiscal year 2017 and reduced product shipments to a customer that experienced credit problems. Additionally, due to the increased value of the U.S. Dollar relative to the Chinese Renminbi, the Company received a series of price reductions from most of its suppliers, which were partially passed along to the Company’s customers. Also affecting sales was the continuing overall sluggish retail environment, coupled with a change in the infant bedding marketplace. Specifically, on the advice of pediatricians, parents are moving more to the concept of a “naked crib”, whereby only a fitted sheet is used in a crib. Bumper pads, sheets, blankets, comforters and other loose bedding and soft objects, such as stuffed toys, wedges and positioners, are recommended to be kept out of the crib. This has resulted in parents purchasing fewer bedding sets in favor of separates and leading to a lower average price point for the Company’s infant bedding products. This trend has been partially offset by the Company’s expanded offerings of separates and infant bedroom décor.
Gross Profit:
Fiscal 2018 Compared with Fiscal 2017
Gross profit increased by $368,000 but decreased from 29.4% of net sales for 2018 to 28.1% of net sales for 2017. The increase in amount is due to higher sales that resulted from the Carousel Acquisition and the Sassy Acquisition, which was offset by a higher level of sales of closeout inventory in the current year at lower margins. Also, sales to Toys-Delaware during the current fiscal year leading up to and continuing through the bankruptcy and liquidation of Toys-Delaware resulted in a shift to a less profitable product mix and shortfalls of minimum guaranteed royalties, which contributed to the decrease in the gross profit percentage.
Fiscal 2017 Compared with Fiscal 2016
Gross profit decreased in amount by $4.4 million but increased as a percentage of net sales from 28.2% to 29.4%. The increase as a percentage of net sales can be attributed to the improved product costs from China, which were the result of favorable exchange rate fluctuations.
Marketing and Administrative Expenses:
Fiscal 2018 Compared with Fiscal 2017
Marketing and administrative expenses increased by $3.6 million for fiscal year 2018 compared with fiscal year 2017. The increase is the result of credit coverage fees of $653,000 and bad debt of $218,000 that did not occur in the prior year and that were associated with the bankruptcy and liquidation of a major retail customer. The Company also incurred higher overall costs during the current year that were associated with the Carousel Acquisition and the Sassy Acquisition, which included $347,000 and $169,000, respectively, in acquisition costs and amortization expense of $183,000 and $56,000, respectively. The current year also included an increase over the prior year of $90,000 in audit fees associated with the Company’s transition from a smaller reporting company to an accelerated filer for SEC purposes.
Fiscal 2017 Compared with Fiscal 2016
Marketing and administrative expenses for fiscal year 2017 declined by $2.3 million compared with fiscal year 2016. The decrease is primarily related to lower overall compensation costs, which declined in fiscal 2017 by $1.4 million as compared with fiscal year 2016.
Income Tax Expense:
Fiscal 2018 Compared with Fiscal 2017
The Company’s overall provision for income taxes increased to 44.3% during 2018 from 36.7% in 2017.
On December 22, 2017, the President of the United States signed into law the TCJA, which includes a provision to lower the federal corporate income tax rate to 21% effective as of January 1, 2018. As the Company’s fiscal year 2018 ended on April 1, 2018, the lower corporate income tax rate was phased in, resulting in a blended federal statutory rate of 30.75% for fiscal year 2018. The Company provides for deferred income taxes based on the difference between the financial statement and tax bases of the Company’s assets and liabilities. The Company’s net deferred income tax assets had previously been recorded based upon the enacted composite federal, state and foreign income tax rate of approximately 37.5% that would have been applied as the financial statement-tax differences began to reverse. Because these differences are now expected to reverse at a composite rate of approximately 24.5%, the Company was required to revalue its net deferred income tax assets. This revaluation resulted in a discrete charge to income tax expense of $377,000 during fiscal year 2018.
Management evaluates items of income, deductions and credits reported on the Company’s various federal and state income tax returns filed and recognizes the effect of positions taken on those income tax returns only if those positions are more likely than not to be sustained. The Company applies the provisions of accounting guidelines that require a minimum recognition threshold that a tax benefit must meet before being recognized in the financial statements. Recognized income tax positions are measured at the largest amount that has a greater than 50% likelihood of being realized. Changes in recognition or measurement are reflected in the period in which the change in judgment occurs.
During fiscal year 2016, an evaluation was made of the Company’s process regarding the calculation of the state portion of its income tax provision. This evaluation resulted in the Company taking a tax position that reflected opportunities for the application of more favorable state apportionment percentages for several prior fiscal years. After considering all relevant information, the Company believes that the technical merits of this tax position would more likely than not be sustained. However, the Company also believes that the ultimate resolution of the tax position will result in a tax benefit that is less than the full amount being sought. Therefore, the Company’s measurement regarding the tax impact of the revised state apportionment percentages resulted in the Company recording a discrete reserve for unrecognized tax benefits during fiscal year 2018 of $113,000, as compared with a reserve of $134,000 during fiscal year 2017. Because the tax impact of the revised state apportionment percentages are measured net of federal income taxes, the provision in the TCJA that lowered the federal corporate income tax rate to 21% required the Company to revalue its reserve for unrecognized tax benefits. This revaluation, which the Company believes is complete, resulted in a net discrete charge to income tax expense of $120,000 during fiscal year 2018.
Income tax expense for fiscal year 2018 included a discrete income tax charge of $37,000 and a discrete income tax benefit of $60,000 to reflect the effect of the tax shortfall and the excess tax benefits, respectively, arising from the vesting of non-vested stock, as compared with $248,000 of net excess tax benefits arising from the effect of such items during fiscal year 2017.
Fiscal 2017 Compared with Fiscal 2016
The Company’s provision for income taxes increased slightly to 36.7% during 2017 from 36.4% in 2016. The Company’s effective tax rate for 2017 was beneficially impacted by the early adoption of revised accounting guidance, which resulted in the recognition of discrete income tax benefits amounting to $248,000 to reflect the effect of net excess tax benefits arising from the exercise of stock options and the vesting of non-vested stock during fiscal year 2017. The Company recorded during 2016 discrete net income tax benefits of approximately $260,000, primarily resulting from the application of more favorable state apportionment percentages to state income tax returns for several prior fiscal years.
Known Trends and Uncertainties
The Company’s financial results are closely tied to sales to the Company’s top three customers, which represented approximately 65% of the Company’s gross sales in fiscal year 2018, including 15% of sales to Toys-Delaware. On September 18, 2017, TRU and Toys-Delaware filed petitions for relief under Chapter 11 of Title 11 of the U.S. Bankruptcy Code with the U.S. Bankruptcy Court for the Eastern District of Virginia. On March 14, 2018, TRU filed a motion with the Court seeking authority to close all of the remaining Toys-Delaware stores and distribution centers in the U.S., and to otherwise discontinue, liquidate and wind-down all U.S. operations of Toys-Delaware. The Company had ceased all shipments to Toys-Delaware shortly before the liquidation filing was made. The Company anticipates that the loss of future business with Toys-Delaware may be mitigated by a shift to the Company’s other customers.
A significant downturn experienced by either or both of the Company’s two remaining top customers could lead to pressure on the Company’s revenues. During fiscal years 2018, 2017 and 2016, the Company at times faced higher raw material costs, as well as increases in labor and transportation costs associated with the Company’s sourcing activities in China. Future increases in these costs could adversely affect the profitability of the Company if it cannot pass the cost increases along to its customers in the form of price increases or if the timing of price increases does not closely match the cost increases. For additional discussion of trends, uncertainties and other factors that could impact the Company’s operating results, refer to “Risk Factors” in Item 1A. of Part I. of this Annual Report on Form 10-K.
Financial Position, Liquidity and Capital Resources
Net cash provided by operating activities decreased from $10.4 million for the fiscal year ended April 2, 2017 to $2.5 million for the fiscal year ended April 1, 2018. In the current year, the Company experienced an increase in its accounts receivable balances that was $8.1 million higher than the decrease in the prior year.
Net cash provided by operating activities decreased from $11.0 million for the fiscal year ended April 3, 2016 to $10.4 million for the fiscal year ended April 2, 2017. In fiscal year 2017, the Company experienced a decrease in its accounts receivable balances that was $3.5 million higher than the decrease in fiscal year 2016. Offsetting this decrease was an increase in inventory in fiscal year 2018 that was $1.7 million higher than fiscal year 2016, as well as net income that was $1.3 million lower in fiscal year 2017 as compared with fiscal year 2016.
Net cash used in investing activities was $15.5 million in fiscal year 2018 compared with $191,000 in fiscal year 2017. The increase in fiscal year 2018 was due primarily to the payment of the purchase price of $8.7 million for the Carousel Acquisition and $6.5 million for the Sassy Acquisition.
Net cash used in investing activities was $191,000 in fiscal year 2017 compared with $324,000 in fiscal year 2016. The decrease in fiscal year 2017 was primarily due to $123,000 used in fiscal year 2016 to purchase certain intangible assets.
Net cash provided by financing activities was $5.3 million in fiscal year 2018 as compared with $9.9 million used in financing activities in the fiscal year 2017, for an overall swing of $15.2 million. The change was primarily associated with net borrowings on the Company’s revolving line of credit during fiscal year 2018 of $9.5 million and a decrease in dividends paid in fiscal year 2018 of $6.5 million as compared with year 2017.
Net cash used in financing activities increased by $5.0 million to $9.9 million in fiscal year 2017. The increase was primarily associated with an increase in dividends paid in fiscal year 2017 of $6.5 million as compared with fiscal year 2016. Offsetting this amount was a $1.9 million decrease in fiscal year 2017 as compared with fiscal year 2016 that were associated with the surrender to the Company’s treasury of a portion of the shares of non-vested stock that vested and from shares issued upon the exercise of options, which was in consideration of the Company remitting the income tax withholding obligations to the appropriate taxing authorities on behalf of the employees of the Company that exercised options and had non-vested stock that vested.
The Company’s future performance is, to a certain extent, subject to general economic, financial, competitive, legislative, regulatory and other factors beyond its control. Based upon the current level of operations, the Company believes that its cash flow from operations and availability on its revolving line of credit will be adequate to meet its liquidity needs.
The Company’s credit facility at April 1, 2018 consisted of a revolving line of credit under a financing agreement with The CIT Group/Commercial Services, Inc. (“CIT”), a subsidiary of CIT Group Inc., of up to $26.0 million, which includes a $1.5 million sub-limit for letters of credit, bearing interest at the rate of prime minus 0.5% or LIBOR plus 2.0%. The financing agreement matures on July 11, 2019 and is secured by a first lien on all assets of the Company. As of April 1, 2018, the Company had elected to pay interest on balances owed under the revolving line of credit under the LIBOR option, which was 3.67% as of April 1, 2018. The financing agreement also provides for the payment by CIT to the Company of interest at the rate of prime as of the beginning of the calendar month minus 2.0%, which was 2.75% as of April 1, 2018, on daily negative balances, if any, held at CIT.
The financing agreement as in effect prior to December 28, 2015 provided for a monthly fee, which was assessed based on 0.125% of the average unused portion of the revolving line of credit, less any outstanding letters of credit (the “Commitment Fee”). The Commitment Fee amounted to $25,000 during fiscal year 2016. The financing agreement was amended on December 28, 2015 to eliminate the Commitment Fee. As of April 1, 2018, there was a balance of $9.5 million owed on the revolving line of credit, there was no letter of credit outstanding and $13.2 million was available under the revolving line of credit based on the Company’s eligible accounts receivable and inventory balances. As of April 2, 2017, there was no balance owed on the revolving line of credit, there was no letter of credit outstanding and $21.4 million was available under the revolving line of credit based on the Company’s eligible accounts receivable and inventory balances.
The financing agreement contains usual and customary covenants for agreements of that type, including limitations on other indebtedness, liens, transfers of assets, investments and acquisitions, merger or consolidation transactions, transactions with affiliates, and changes in or amendments to the organizational documents for the Company and its subsidiaries. The Company believes it was in compliance with these covenants as of April 1, 2018.
To reduce its exposure to credit losses, the Company assigns the majority of its trade accounts receivable to CIT pursuant to factoring agreements, which have expiration dates that are coterminous with that of the financing agreement described above. Under the terms of the factoring agreements, CIT remits customer payments to the Company as such payments are received by CIT.
CIT bears credit losses with respect to assigned accounts receivable from approved shipments, while the Company bears the responsibility for adjustments from customers related to returns, allowances, claims and discounts. CIT may at any time terminate or limit its approval of shipments to a particular customer. If such a termination or limitation occurs, the Company either assumes (and may seek to mitigate) the credit risk for shipments to the customer after the date of such termination or limitation or discontinues shipments to the customer. Factoring fees, which are included in marketing and administrative expenses in the accompanying consolidated statements of income, were $223,000, $395,000 and $556,000 during fiscal years 2018, 2017 and 2016, respectively. There were no advances on the factoring agreements at April 1, 2018 or April 2, 2017.
Contractual Obligations
The Company’s contractual obligations as of April 1, 2018 are as follows (in thousands):
|
Payments due by period |
||||||||||||||||||||
|
|
Total |
2019 |
2020 - 2021 | 2022 - 2023 |
Thereafter |
|||||||||||||||
| Contractual Obligations | ||||||||||||||||||||
|
Purchase obligations |
$ | - | $ | - | $ | - | $ | - | $ | - | ||||||||||
|
Long-term debt - principal |
9,458 | - | 9,458 | - | - | |||||||||||||||
|
Long-term debt - estimate of interest |
230 | 180 | 50 | - | - | |||||||||||||||
|
Capital lease obligations |
- | - | - | - | - | |||||||||||||||
|
Operating lease obligations |
3,306 | 1,453 | 1,853 | - | - | |||||||||||||||
|
Minimum guaranteed royalties |
4,418 | 2,894 | 1,524 | - | - | |||||||||||||||
|
Total |
$ | 17,412 | $ | 4,527 | $ | 12,885 | $ | - | $ | - | ||||||||||
Critical Accounting Policies and Estimates
The Company prepares its financial statements to conform with accounting principles generally accepted in the U.S. (“GAAP”) as promulgated by the Financial Accounting Standards Board (“FASB”). References herein to GAAP are to topics within the FASB Accounting Standards Codification (the “FASB ASC”), which the FASB periodically revises through the issuance of an Accounting Standards Update (“ASU”) and which has been established by the FASB as the authoritative source for GAAP recognized by the FASB to be applied by nongovernmental entities.
Use of Estimates: The preparation of financial statements in conformity with GAAP requires management to make estimates and assumptions that affect the reported amounts of assets and liabilities and disclosure of contingent assets and liabilities at the date of the consolidated balance sheets and the reported amounts of revenues and expenses during the reporting period. The listing below, while not inclusive of all of the Company's accounting policies, sets forth those accounting policies which the Company's management believes embody the most significant judgments due to the uncertainties affecting their application and the likelihood that materially different amounts would be reported under different conditions or using different assumptions.
Revenue Recognition: Sales made directly to consumers are recorded when shipped products have been received by customers. Sales made to retailers are recorded when products are shipped to customers and are reported net of anticipated returns, which are estimated based on historical rates, and other allowances in the accompanying consolidated statements of income. Reserves for returns and other allowances, including cooperative advertising allowances, warehouse allowances, placement fees and volume rebates, are recorded commensurate with sales activity or using the straight-line method, as appropriate, and the cost of such allowances is netted against sales in reporting the results of operations. Shipping costs are included in cost of products sold.
Allowances Against Accounts Receivable: The Company’s allowances against accounts receivable are primarily contractually agreed-upon deductions for items such as cooperative advertising and warehouse allowances, placement fees and volume rebates. These deductions are recorded throughout the year commensurate with sales activity or using the straight-line method, as appropriate. Funding of the majority of the Company’s allowances occurs on a per-invoice basis. The allowances for customer deductions, which are netted against accounts receivable in the consolidated balance sheets, consist of agreed-upon cooperative advertising support, placement fees, markdowns and warehouse and other allowances. All such allowances are recorded as direct offsets to sales, and such costs are accrued commensurate with sales activities or as a straight-line amortization charge of an agreed-upon fixed amount, as appropriate to the circumstances for each arrangement. When a customer requests deductions, the allowances are reduced to reflect such payments or credits issued against the customer’s account balance. The Company analyzes the components of the allowances for customer deductions monthly and adjusts the allowances to the appropriate levels. The timing of the customer-initiated funding requests for advertising support can cause the net balance in the allowance account to fluctuate from period to period. The timing of such funding requests has a minimal impact on the consolidated statements of income since such costs are accrued commensurate with sales activity or using the straight-line method, as appropriate.
To reduce its exposure to credit losses, the Company assigns the majority of its receivables under factoring agreements with CIT. In the event a factored receivable becomes uncollectible due to creditworthiness, CIT bears the risk of loss. The Company’s management must make estimates of the uncollectiblity of its non-factored accounts receivable when evaluating the adequacy of its allowance for doubtful accounts, which it accomplishes by specifically analyzing accounts receivable, historical bad debts, customer concentrations, customer creditworthiness, current economic trends and changes in its customers’ payment terms.
Purchase Price Allocations and the Resulting Goodwill: From time to time, the Company has entered into transactions accounted for as business combinations, including in the current year the Carousel Acquisition and the Sassy Acquisition. In connection with a business combination, the Company must prepare an allocation of the cost of the acquisition to the identifiable assets acquired and liabilities assumed, based on estimated fair values as of the acquisition date. The excess of the purchase price over the estimated fair value of the identifiable net assets acquired is recorded as goodwill.
The amount of goodwill recorded in a business combination can vary significantly depending upon the values attributed to the assets acquired and liabilities assumed. Although goodwill has no useful life and is not subject to a systematic annual amortization against earnings, the Company performs a measurement for impairment of the carrying value of its goodwill annually on the first day of the Company’s fiscal year. An additional impairment test is performed during the year whenever an event or change in circumstances suggest that the fair value of the goodwill of either of the reporting units of the Company has more likely than not fallen below its carrying value. The annual or interim measurement for impairment of goodwill is performed at the reporting unit level. A reporting unit is either an operating segment or one level below an operating segment. In its annual or interim measurement for impairment of goodwill, the Company conducts a qualitative assessment by examining relevant events and circumstances which could have a negative impact on the Company’s goodwill, which includes macroeconomic conditions, industry and market conditions, commodity prices, cost factors, overall financial performance, reporting unit dispositions and acquisitions, the market capitalization of the Company and other relevant events specific to the Company.
If, after assessing the totality of events or circumstances described above, the Company determines that it is more likely than not that the fair value of either of the Company's reporting units is less than its carrying amount, the two-step goodwill test is performed. The two-step goodwill impairment test is also performed whenever events or changes in circumstances indicate that the carrying value may not be recoverable. If, after performing the two-step goodwill test, it is determined that the carrying value of goodwill is impaired, the amount of goodwill is reduced and a corresponding charge is made to earnings in the period in which the goodwill is determined to be impaired.
The two-step impairment test is used to identify potential goodwill impairment and measure the amount of a goodwill impairment loss to be recognized. The first step of the goodwill impairment test, used to identify potential impairment, compares the fair value of a reporting unit with its carrying amount, including goodwill. If the fair value of a reporting unit exceeds its carrying amount, goodwill is not considered to be impaired, and the second step of the test is not required. If necessary, the second step of the impairment test, used to measure the amount of impairment loss, compares the implied fair value of reporting unit goodwill with the carrying amount of that goodwill. If the carrying amount of the goodwill of a reporting unit exceeds the implied fair value of that goodwill, an impairment loss is recognized in an amount equal to the excess.
Preparing a purchase price allocation requires estimating the fair values of assets acquired and liabilities assumed in a business combination, a process that requires the Company to make various assumptions. The most significant assumptions relate to the estimated fair values assigned to the assets acquired and liabilities assumed as of the acquisition date. The resulting estimated fair values assigned to assets acquired and liabilities assumed in a purchase price allocation can have a significant effect on results of operations in the future. A future impairment to goodwill would have no effect on the Company’s cash flows, but would result in a decrease in net income for the period in which the impairment is recorded.
Subsequent Valuation of Long-Lived Assets and Identifiable Intangible Assets: In addition to the systematic annual depreciation and amortization of the Company’s fixed assets and identifiable intangible assets, the Company reviews for impairment long-lived assets and identifiable intangible assets whenever events or changes in circumstances indicate that the carrying amount of any asset may not be recoverable. In the event of impairment, the asset is written down to its fair market value. Assets to be disposed of, if any, are recorded at the lower of net book value or fair market value, less estimated costs to sell at the date management commits to a plan of disposal, and are classified as assets held for sale on the consolidated balance sheets.
Inventory Valuation: On a periodic basis, management reviews its inventory quantities on hand for obsolescence, physical deterioration, changes in price levels and the existence of quantities on hand which may not reasonably be expected to be sold within the Company’s normal operating cycle. To the extent that any of these conditions is believed to exist or the market value of the inventory expected to be realized in the ordinary course of business is otherwise no longer as great as its carrying value, an allowance against the inventory value is established. To the extent that this allowance is established or increased during an accounting period, an expense is recorded in cost of products sold in the Company's consolidated statements of income. Only when inventory for which an allowance has been established is later sold or is otherwise disposed is the allowance reduced accordingly. Significant management judgment is required in determining the amount and adequacy of this allowance. In the event that actual results differ from management's estimates or these estimates and judgments are revised in future periods, the Company may not fully realize the carrying value of its inventory or may need to establish additional allowances, either of which could materially impact the Company's financial position and results of operations.
Royalty Payments: The Company has entered into agreements that provide for royalty payments based on a percentage of sales with certain minimum guaranteed amounts. These royalty amounts are accrued based upon historical sales rates adjusted for current sales trends by customers. Royalty expense is included in cost of products sold in the accompanying consolidated statements of income and amounted to $7.2 million, $7.0 million and $9.0 million for fiscal years 2018, 2017 and 2016, respectively.
ITEM 7A. Quantitative and Qualitative Disclosures About Market Risk
For a detailed discussion of market risk and other factors that could impact the Company’s operating results, refer to “Risk Factors” in Item 1A. of Part I. of this Annual Report on Form 10-K.
Interest Rate Risk
As of April 1, 2018, the Company had $9.5 million of indebtedness that bears interest at a variable rate, comprised of borrowings under the revolving line of credit. Based upon this level of outstanding debt, the Company’s annual net income would decrease by approximately $70,000 for each increase of one percentage point in the interest rate applicable to the debt.
Commodity Rate Risk
The Company sources its products primarily from foreign contract manufacturers, with the largest concentration being in China. The Company’s exposure to commodity price risk primarily relates to changes in the prices in China of cotton, oil and labor, which are the principal inputs used in a substantial number of the Company’s products. Also, although the Company’s purchases of its products from its Chinese suppliers are paid in U.S. dollars, an arbitrary strengthening of the rate of the Chinese currency versus the U.S. dollar could result in an increase in the cost of the prices at which the Company purchases its finished goods. There can be no assurance that the Company could timely respond to such increases by proportionately increasing the prices at which its products are sold to the Company’s customers.
Market Concentration Risk
The Company’s financial results are closely tied to sales to the Company’s top three customers, which represented approximately 65% of the Company’s gross sales in fiscal year 2018, including 15% of sales to Toys-Delaware. On September 18, 2017, TRU and Toys-Delaware filed petitions for relief under Chapter 11 of Title 11 of the U.S. Bankruptcy Code with the U.S. Bankruptcy Court for the Eastern District of Virginia. On March 14, 2018, TRU filed a motion with the Court seeking authority to close all of the remaining Toys-Delaware stores and distribution centers in the U.S., and to otherwise discontinue, liquidate and wind-down all U.S. operations of Toys-Delaware. The Company had ceased all shipments to Toys-Delaware shortly before the liquidation filing was made. The Company anticipates that the loss of future business with Toys-Delaware may be mitigated by a shift to the Company’s other customers. A significant downturn experienced by either or both of the Company’s two remaining top customers could lead to pressure on the Company’s revenues.
For the fiscal year ended April 1, 2018, 52% of the Company’s gross sales consisted of licensed products, which included 34% of sales associated with the Company’s license agreements with Disney. The Company’s results could be materially impacted by the loss of one or more of these licenses.
ITEM 8. Financial Statements and Supplementary Data
Refer to pages 25 and F-1 through F-25 hereof.
ITEM 9. Changes in and Disagreements With Accountants on Accounting and Financial Disclosure
Not applicable.
ITEM 9A. Controls and Procedures
Disclosure Controls and Procedures
Disclosure controls and procedures are designed to ensure that information required to be disclosed in the reports filed or submitted under the Exchange Act is recorded, processed, summarized and reported within the time period specified in the SEC’s rules and forms. Disclosure controls and procedures include, without limitation, controls and procedures designed to ensure that information required to be disclosed in the reports filed under the Exchange Act is accumulated and communicated to management, including the Chief Executive Officer and Chief Financial Officer, as appropriate, to allow timely decisions regarding required disclosure. As of the end of the period covered by this report, the Company carried out an assessment, under the supervision and with the participation of the Company’s management, including the Chief Executive Officer and Chief Financial Officer, of the effectiveness of the design and operation of the Company’s disclosure controls and procedures. Based upon and as of the date of that assessment, the Chief Executive Officer and Chief Financial Officer concluded that the Company’s disclosure controls and procedures are effective.
Management’s Annual Report on Internal Control over Financial Reporting
The Company’s management is responsible for establishing and maintaining for the Company adequate internal control over financial reporting, as such term is defined in Rules 13a-15(f) and 15d-15(f) under the Exchange Act (“ICFR”). With the participation of the Chief Executive Officer and the Chief Financial Officer, management conducted an assessment of the effectiveness of internal control over financial reporting based on the framework and the criteria established in Internal Control — Integrated Framework (2013) issued by the Committee of Sponsoring Organizations of the Treadway Commission.
In management’s assessment of ICFR during fiscal year 2018, the Company has excluded an assessment of the ICFR related to the operations of Carousel, which consummated the Carousel Acquisition on August 4, 2017. During fiscal year 2018, the net sales of Carousel were $5.4 million, which was 7.7% of the Company’s total net sales. As of April 1, 2018, the total assets of Carousel amounted to $10.3 million (including $5.7 million in goodwill), which was 18.2% of the Company’s total assets.
In management’s assessment of ICFR during fiscal year 2018, the Company has excluded an assessment of the ICFR related to the operations associated with the Sassy Acquisition, which was consummated on December 15, 2017. During fiscal year 2018, the net sales added as a result of the Sassy Acquisition were $2.1 million, which was 3.0% of the Company’s total net sales. The net assets acquired in the Sassy Acquisition amounted to $6.5 million (including $320,000 in goodwill), which was 11.5% of the Company’s total assets as of April 1, 2018.
Based on management’s assessment of ICFR, taking into account the exclusion of assessments of the ICFR related to the operations of Carousel and the operations associated with the Sassy Acquisition, management has concluded that internal control over financial reporting was effective as of April 1, 2018. The Company’s internal control over financial reporting as of April 1, 2018 has been audited by KPMG LLP, an independent registered public accounting firm, as stated in its report which is included in Item 8. of this Annual Report on Form 10-K.
The Company’s internal control system was designed to provide reasonable assurance to the Company’s management and the Board of Directors regarding the reliability of financial reporting and the preparation and fair presentation of financial statements in accordance with GAAP. All internal control systems, no matter how well designed, have inherent limitations. Therefore, even those systems determined to be effective can provide only a reasonable, rather than absolute, assurance that the Company’s financial statements are free of any material misstatement, whether caused by error or fraud.
Changes in Internal Control over Financial Reporting
The Company’s management, with the participation of the Company’s Chief Executive Officer and Chief Financial Officer, conducted an assessment of the Company’s ICFR as required by Rule 13a-15(d) under the Exchange Act and, in connection with such assessment and taking into account the exclusion of assessments of the ICFR related to the operations of Carousel and the operations associated with the Sassy Acquisition referred to above, determined that no changes occurred during the Company’s fiscal quarter ended April 1, 2018 that have materially affected, or are reasonably likely to materially affect, the Company’s ICFR.
Not applicable.
ITEM 10. Directors, Executive Officers and Corporate Governance
The information with respect to the Company's directors and executive officers will be set forth in the Company's Proxy Statement for the Annual Meeting of Stockholders to be held in 2018 (the "Proxy Statement") under the captions "Proposal 1 – Election of Directors" and “Executive Officers” and is incorporated herein by reference. The information with respect to Item 405 of Regulation S-K will be set forth in the Proxy Statement under the caption "Section 16(a) Beneficial Ownership Reporting Compliance" and is incorporated herein by reference. The information with respect to Item 406 of Regulation S-K will be set forth in the Proxy Statement under the caption “Code of Business Conduct and Ethics” and is incorporated herein by reference. The information with respect to Item 407 of Regulation S-K will be set forth in the Proxy Statement under the captions “Board Committees and Meetings” and “Report of the Audit Committee” and is incorporated herein by reference.
ITEM 11. Executive Compensation
The information set forth under the caption "Executive Compensation" in the Proxy Statement is incorporated herein by reference.
ITEM 12. Security Ownership of Certain Beneficial Owners and Management and Related Stockholder Matters
The information set forth under the caption "Security Ownership of Certain Beneficial Owners and Management" in the Proxy Statement is incorporated herein by reference.
Securities Authorized for Issuance under Equity Compensation Plans
The table below sets forth information regarding shares of the Company’s common stock that may be issued upon the exercise of options, warrants and other rights granted to employees, consultants or directors under all of the Company’s existing equity compensation plans as of April 1, 2018.
|
Plan Category |
Number of securities to be issued upon exercise of outstanding options, warrants and rights |
Weighted- average exercise price of outstanding options, warrants and rights |
Number of securities remaining available for future issuance under equity compensation plans |
|||||||||
|
Equity compensation plans approved by security holders: |
||||||||||||
| 2006 Omnibus Incentive Plan | 105,000 | $ | 6.95 | 0 | ||||||||
| 2014 Omnibus Equity Compensation Plan | 290,000 | $ | 8.28 | 671,513 | ||||||||
ITEM 13. Certain Relationships and Related Transactions, and Director Independence
The information set forth under the captions “Director Independence” and "Certain Relationships and Related Transactions" in the Proxy Statement is incorporated herein by reference.
ITEM 14. Principal Accountant Fees and Services
The information set forth under the caption “Proposal 2 – Ratification of Appointment of Independent Registered Public Accounting Firm” in the Proxy Statement is incorporated herein by reference.
ITEM 15. Exhibits and Financial Statement Schedules
(a)(1). Financial Statements
The following consolidated financial statements of the Company are filed with this report and included in Part II, Item 8.:
|
- Reports of Independent Registered Public Accounting Firm |
|
|
- Consolidated Balance Sheets as of April 1, 2018 and April 2, 2017 |
|
|
- Consolidated Statements of Income for the Fiscal Years Ended April 1, 2018, April 2, 2017 and April 3, 2016 |
|
|
- Consolidated Statements of Changes in Shareholders' Equity for the Fiscal Years Ended April 1, 2018, April 2, 2017 and April 3, 2016 |
|
|
- Consolidated Statements of Cash Flows for the Fiscal Years Ended April 1, 2018, April 2, 2017 and April 3, 2016 |
|
|
- Notes to Consolidated Financial Statements |
|
(a)(2). Financial Statement Schedule
The following financial statement schedule of the Company is filed with this report:
|
Schedule II — Valuation and Qualifying Accounts |
Page 25 |
All other schedules not listed above have been omitted because they are not applicable or the required information is included in the financial statements or notes thereto.
SCHEDULE II
CROWN CRAFTS, INC. AND SUBSIDIARIES
ANNUAL REPORT ON FORM 10-K
|
Valuation and Qualifying Accounts |
||||||||||||||||
|
Column A |
Column B |
Column C |
Column D |
Column E |
||||||||||||
|
Balance at Beginning of Period |
Charged to Expenses |
Deductions |
Balance at End of Period |
|||||||||||||
|
(in thousands) |
||||||||||||||||
|
Accounts Receivable Valuation Accounts: |
||||||||||||||||
|
Year Ended April 3, 2016 |
||||||||||||||||
|
Allowance for customer deductions |
$ | 1,000 | $ | 3,495 | $ | 3,750 | $ | 745 | ||||||||
|
Year Ended April 2, 2017 |
||||||||||||||||
|
Allowance for customer deductions |
$ | 745 | $ | 3,695 | $ | 3,665 | $ | 775 | ||||||||
|
Year Ended April 1, 2018 |
||||||||||||||||
|
Allowance for customer deductions |
$ | 775 | $ | 3,749 | $ | 3,959 | $ | 565 | ||||||||
|
Allowance for doubtful accounts |
$ | 0 | $ | 218 | $ | 218 | $ | 0 | ||||||||
(a)(3). Exhibits
Exhibits required to be filed by Item 601 of SEC Regulation S-K are included as Exhibits to this report as follows:
|
Exhibit |
|||
|
Number |
Description of Exhibits |
||
|
3.1 |
— |
Amended and Restated Certificate of Incorporation of the Company. (2) |
|
|
3.2 |
— |
||
|
3.3 |
— |
Bylaws of the Company, as amended and restated through November 15, 2016. (22) |
|
|
4.1* |
— |
Crown Crafts, Inc. 2006 Omnibus Incentive Plan (As Amended August 14, 2012). (15) |
|
|
4.2* |
— |
Form of Non-Qualified Stock Option Agreement (Employees). (5) |
|
|
4.3* |
— |
Crown Crafts, Inc. 2014 Omnibus Equity Compensation Plan. (17) |
|
|
4.4* |
— |
||
|
4.5* |
— |
||
|
4.6* |
— |
||
|
10.1* |
— |
Employment Agreement dated July 23, 2001 by and between the Company and E. Randall Chestnut. (1) |
|
|
10.2* |
— |
||
|
10.3* |
— |
||
|
10.4 |
— |
||
|
10.5 |
— |
||
|
10.6 |
— |
||
|
10.7* |
— |
Employment Agreement dated November 6, 2008 by and between the Company and Olivia W. Elliott (7) |
|
|
10.8* |
— |
||
|
10.9* |
— |
||
|
10.10* |
— |
||
|
10.11 |
— |
||
|
10.12 |
— |
||
|
10.13 |
— |
||
|
10.14 |
— |
||
|
10.15* |
— |
||
|
10.16 |
— |
||
_______________
| * | Management contract or a compensatory plan or arrangement. | |
|
(1) |
Incorporated herein by reference to Registrant’s Current Report on Form 8-K dated July 23, 2001. |
|
|
(2) |
Incorporated herein by reference to Registrant’s Quarterly Report on Form 10-Q for the quarter ended December 28, 2003. |
|
|
(3) |
Incorporated herein by reference to Registrant’s Annual Report on Form 10-K for the fiscal year ended March 28, 2004. |
|
|
(4) |
Incorporated herein by reference to Registrant’s Current Report on Form 8-K dated July 17, 2006. |
|
|
(5) |
Incorporated herein by reference to Registrant’s Registration Statement on Form S-8 dated August 24, 2006. |
|
|
(6) |
Incorporated herein by reference to Registrant’s Current Report on Form 8-K dated November 9, 2007. |
|
|
(7) |
Incorporated herein by reference to Registrant’s Current Report on Form 8-K/A dated November 7, 2008. |
|
|
(8) |
Incorporated herein by reference to Registrant’s Current Report on Form 8-K dated November 7, 2008. |
|
|
(9) |
Incorporated herein by reference to Registrant’s Current Report on Form 8-K dated July 6, 2009. |
|
|
(10) |
Incorporated herein by reference to Registrant’s Current Report on Form 8-K dated March 8, 2010. |
|
|
(11) |
Incorporated herein by reference to Registrant’s Current Report on Form 8-K dated May 27, 2010. |
|
|
(12) |
Incorporated herein by reference to Registrant’s Current Report on Form 8-K dated August 9, 2011. |
|
|
(13) |
Incorporated herein by reference to Registrant’s Current Report on Form 8-K dated March 27, 2012. |
|
|
(14) |
Incorporated herein by reference to Registrant’s Current Report on Form 8-K dated March 30, 2012. |
|
|
(15) |
Incorporated herein by reference to Registrant’s Registration Statement on Form S-8 dated August 14, 2012. |
|
|
(16) |
Incorporated herein by reference to Registrant’s Current Report on Form 8-K dated May 21, 2013. |
|
|
(17) |
Incorporated herein by reference to Appendix A to the Registrant’s Definitive Proxy Statement on Schedule 14A filed on June 27, 2014. |
|
|
(18) |
Incorporated herein by reference to Registrant’s Registration Statement on Form S-8 dated November 10, 2014. |
|
|
(19) |
Incorporated herein by reference to Registrant’s Current Report on Form 8-K dated December 28, 2015. |
|
|
(20) |
Incorporated herein by reference to Registrant’s Current Report on Form 8-K dated April 4, 2016. |
|
|
(21) |
Incorporated herein by reference to Registrant’s Quarterly Report on Form 10-Q for the quarter ended October 2, 2016. |
|
|
(22) |
Incorporated herein by reference to Registrant’s Current Report on Form 8-K dated November 16, 2016. |
|
|
(23) |
Incorporated herein by reference to Registrant’s Current Report on Form 8-K dated August 7, 2017. |
|
|
(24) |
Incorporated herein by reference to Registrant’s Current Report on Form 8-K dated December 18, 2017. |
|
|
(25) |
Filed herewith. |
|
|
(26) |
Furnished herewith. |
SIGNATURES
Pursuant to the requirements of Section 13 or 15(d) of the Securities Exchange Act of 1934, the Registrant has duly caused this report to be signed on its behalf by the undersigned, thereunto duly authorized.
CROWN CRAFTS, INC.
By: /s/ E. Randall Chestnut
E. Randall Chestnut
Chairman of the Board, President and Chief Executive Officer
Pursuant to the requirements of the Securities Exchange Act of 1934, this report has been signed below by the following persons on behalf of the Registrant and in the capacities and on the dates indicated:
|
Signatures |
Title |
Date |
||
|
/s/ E. Randall Chestnut |
Chairman of the Board, President and Chief Executive Officer (Principal Executive Officer) |
June 13, 2018 |
||
|
E. Randall Chestnut |
|
|||
|
/s/ Olivia W. Elliott |
Vice President and Chief Financial Officer (Principal Financial Officer and Principal Accounting Officer) |
June 13, 2018 |
||
|
Olivia W. Elliott |
|
|||
|
/s/ Sidney Kirschner |
Director |
June 13, 2018 |
||
|
Sidney Kirschner |
||||
|
/s/ Zenon S. Nie |
Director |
June 13, 2018 |
||
|
Zenon S. Nie |
||||
|
/s/ Donald Ratajczak |
Director |
June 13, 2018 |
||
|
Donald Ratajczak |
||||
|
/s/ Patricia Stensrud |
Director |
June 13, 2018 |
||
|
Patricia Stensrud |
ITEM 8. Financial Statements and Supplementary Data
INDEX TO CONSOLIDATED FINANCIAL STATEMENTS
|
|
Page |
|
Audited Financial Statements: |
|
|
F-1 |
|
|
Consolidated Balance Sheets as of April 1, 2018 and April 2, 2017 |
F-4 |
|
F-5 |
|
|
F-6 |
|
|
F-7 |
|
|
F-8 |
Report of Independent Registered Public Accounting Firm
To the Shareholders and Board of Directors
Crown Crafts, Inc.:
Opinion on the Consolidated Financial Statements
We have audited the accompanying consolidated balance sheets of Crown Crafts, Inc. and subsidiaries (the Company) as of April 1, 2018 and April 2, 2017, the related consolidated statements of income, changes in shareholders’ equity, and cash flows for each of the years in the three-year period ended April 1, 2018, and the related notes and financial statement schedule II (collectively, the consolidated financial statements). In our opinion, the consolidated financial statements present fairly, in all material respects, the financial position of the Company as of April 1, 2018 and April 2, 2017, and the results of its operations and its cash flows for each of the years in the three-year period ended April 1, 2018, in conformity with U.S. generally accepted accounting principles.
We also have audited, in accordance with the standards of the Public Company Accounting Oversight Board (United States) (PCAOB), the Company’s internal control over financial reporting as of April 1, 2018, based on the criteria established in Internal Control – Integrated Framework (2013) issued by the Committee of Sponsoring Organizations of the Treadway Commission, and our report dated June 13, 2018 expressed an unqualified opinion on the effectiveness of the Company’s internal control over financial reporting.
Basis for Opinion
These consolidated financial statements are the responsibility of the Company’s management. Our responsibility is to express an opinion on these consolidated financial statements based on our audits. We are a public accounting firm registered with the PCAOB and are required to be independent with respect to the Company in accordance with the U.S. federal securities laws and the applicable rules and regulations of the Securities and Exchange Commission and the PCAOB.
We conducted our audits in accordance with the standards of the PCAOB. Those standards require that we plan and perform the audit to obtain reasonable assurance about whether the consolidated financial statements are free of material misstatement, whether due to error or fraud. Our audit included performing procedures to assess the risks of material misstatement of the consolidated financial statements, whether due to error or fraud, and performing procedures that respond to those risks. Such procedures included examining, on a test basis, evidence regarding the amounts and disclosures in the consolidated financial statements. Our audits also included evaluating the accounting principles used and significant estimates made by management, as well as evaluating the overall presentation of the consolidated financial statement. We believe that our audits provide a reasonable basis for our opinion.
/s/ KPMG LLP
We have served as the Company’s auditor since 2009.
Baton Rouge, Louisiana
June 13, 2018
Report of Independent Registered Public Accounting Firm
The Shareholders and Board of Directors
Crown Crafts, Inc.:
Opinion on Internal Control Over Financial Reporting
We have audited Crown Crafts, Inc. and subsidiaries’ (the Company) internal control over financial reporting as of April 1, 2018, based on the criteria established in Internal Control – Integrated Framework (2013) issued by the Committee of Sponsoring Organizations of the Treadway Commission. In our opinion, the Company maintained, in all material respects, effective internal control over financial reporting as of April 1, 2018 based on the criteria established in Internal Control – Integrated Framework (2013) issued by the Committee of Sponsoring Organizations of the Treadway Commission.
We have also audited, in accordance with the standards of the Public Company Accounting Oversight Board (United States) (PCAOB), the consolidated balance sheets of the Company as of April 1, 2018 and April 2, 2017, and the related consolidated statements of income, changes in shareholders’ equity, and cash flows for each of the years in the three-year period ended April 1, 2018, and related notes and financial statement schedule II, and our report dated June 13, 2018 expressed an unqualified opinion on those consolidated financial statements.
The Company completed business combinations with Carousel Designs, LLC (Carousel) and Sassy 14, LLC (Sassy) during fiscal year 2018, and management excluded from its assessment of the effectiveness of the Company’s internal control over financial reporting as of April 1, 2018, both Carousel and Sassy’s internal controls over financial reporting associated with Carousel’s total assets of $10.3 million and net sales of $5.4 million and Sassy’s acquired assets of $6.5 million and net sales of $2.1 million included in the consolidated financial statements of the Company as of and for the year ended April 1, 2018. Our audit of internal control over financial reporting of the Company also excluded an evaluation of the internal control over financial reporting of Carousel and Sassy.
Basis for Opinion
The Company’s management is responsible for maintaining effective internal control over financial reporting and for its assessment of the effectiveness of the Company’s internal control over financial reporting, included in the accompanying Management’s Annual Report on Internal Control over Financial Reporting. Our responsibility is to express an opinion on the Company’s internal control over financial reporting based on our audit. We are a public accounting firm registered with the PCAOB and are required to be independent with respect to the Company in accordance with the U.S. federal securities laws and the applicable rules and regulations of the Securities and Exchange Commission and the PCAOB.
We conducted our audits in accordance with the standards of the PCAOB. Those standards require that we plan and perform the audit to obtain reasonable assurance about whether effective internal control over financial reporting was maintained in all material respects. Our audit included obtaining an understanding of internal control over financial reporting, assessing the risk that a material weakness exists, and testing and evaluating the design and operating effectiveness of internal control based on the assessed risk. Our audit also included performing such other procedures as we considered necessary in the circumstances. We believe that our audit provides a reasonable basis for our opinion.
Definition and Limitations of Internal Control over Financial Reporting
A company’s internal control over financial reporting is a process designed to provide reasonable assurance regarding the reliability of financial reporting and the preparation of financial statements for external purposes in accordance with generally accepted accounting principles. A company’s internal control over financial reporting includes those policies and procedures that (1) pertain to the maintenance of records that, in reasonable detail, accurately and fairly reflect the transactions and dispositions of the assets of the company; (2) provide reasonable assurance that transactions are recorded as necessary to permit preparation of financial statements in accordance with generally accepted accounting principles, and that receipts and expenditures of the company are being made only in accordance with authorizations of management and directors of the company; and (3) provide reasonable assurance regarding prevention or timely detection of unauthorized acquisition, use, or disposition of the company’s assets that could have a material effect on the financial statements.
Because of its inherent limitations, internal control over financial reporting may not prevent or detect misstatements. Also, projections of any evaluation of effectiveness to future periods are subject to the risk that controls may become inadequate because of changes in conditions, or that the degree of compliance with the policies or procedures may deteriorate.
/s/ KPMG LLP
Baton Rouge, Louisiana
June 13, 2018
CROWN CRAFTS, INC. AND SUBSIDIARIES
APRIL 1, 2018 AND APRIL 2, 2017
(amounts in thousands, except share and per share amounts)
|
April 1, 2018 |
April 2, 2017 |
|||||||
|
ASSETS |
||||||||
|
Current assets: |
||||||||
|
Cash and cash equivalents |
$ | 215 | $ | 7,892 | ||||
|
Accounts receivable (net of allowances of $565 at April 1, 2018 and $775 at April 2, 2017): |
||||||||
|
Due from factor |
15,447 | 14,921 | ||||||
|
Other |
3,051 | 693 | ||||||
|
Inventories |
19,788 | 15,821 | ||||||
|
Prepaid expenses |
1,253 | 1,783 | ||||||
|
Total current assets |
39,754 | 41,110 | ||||||
|
Property, plant and equipment - at cost: |
||||||||
|
Vehicles |
268 | 247 | ||||||
|
Leasehold improvements |
272 | 248 | ||||||
|
Machinery and equipment |
4,010 | 2,396 | ||||||
|
Furniture and fixtures |
799 | 789 | ||||||
|
Property, plant and equipment - gross |
5,349 | 3,680 | ||||||
|
Less accumulated depreciation |
3,571 | 3,239 | ||||||
|
Property, plant and equipment - net |
1,778 | 441 | ||||||
|
Finite-lived intangible assets - at cost: |
||||||||
| Tradename and trademarks | 3,667 | 1,987 | ||||||
|
Customer relationships |
7,374 | 5,534 | ||||||
|
Other finite-lived intangible assets |
3,159 | 1,699 | ||||||
|
Finite-lived intangible assets - gross |
14,200 | 9,220 | ||||||
|
Less accumulated amortization |
6,928 | 6,092 | ||||||
|
Finite-lived intangible assets - net |
7,272 | 3,128 | ||||||
|
Goodwill |
7,125 | 1,126 | ||||||
|
Deferred income taxes |
532 | 1,240 | ||||||
|
Other |
120 | 139 | ||||||
|
Total Assets |
$ | 56,581 | $ | 47,184 | ||||
|
LIABILITIES AND SHAREHOLDERS' EQUITY |
||||||||
|
Current liabilities: |
||||||||
|
Accounts payable |
$ | 3,766 | $ | 5,149 | ||||
|
Accrued wages and benefits |
842 | 799 | ||||||
|
Accrued royalties |
793 | 353 | ||||||
|
Dividends payable |
807 | 803 | ||||||
|
Income taxes payable |
40 | 224 | ||||||
|
Other accrued liabilities |
540 | 245 | ||||||
|
Total current liabilities |
6,788 | 7,573 | ||||||
|
Non-current liabilities: |
||||||||
|
Long-term debt |
9,458 | - | ||||||
|
Reserve for unrecognized tax liabilities |
1,017 | 688 | ||||||
|
Total non-current liabilities |
10,475 | 688 | ||||||
|
Shareholders' equity: |
||||||||
|
Common stock - $0.01 par value per share; Authorized 40,000,000 shares at April 1, 2018 and April 2, 2017; Issued 12,493,789 shares at April 1, 2018 and 12,423,539 shares at April 2, 2017 |
125 | 124 | ||||||
|
Additional paid-in capital |
52,874 | 52,220 | ||||||
|
Treasury stock - at cost - 2,408,025 shares at April 1, 2018 and 2,401,066 shares at April 2, 2017 |
(12,231 | ) | (12,175 | ) | ||||
|
Accumulated Deficit |
(1,450 | ) | (1,246 | ) | ||||
|
Total shareholders' equity |
39,318 | 38,923 | ||||||
|
Total Liabilities and Shareholders' Equity |
$ | 56,581 | $ | 47,184 | ||||
See notes to consolidated financial statements.
CROWN CRAFTS, INC. AND SUBSIDIARIES
CONSOLIDATED STATEMENTS OF INCOME
FISCAL YEARS ENDED APRIL 1, 2018, APRIL 2, 2017 and APRIL 3, 2016
(amounts in thousands, except per share amounts)
|
2018 |
2017 |
2016 |
||||||||||
|
Net sales |
$ | 70,270 | $ | 65,978 | $ | 84,342 | ||||||
|
Cost of products sold |
50,491 | 46,567 | 60,529 | |||||||||
|
Gross profit |
19,779 | 19,411 | 23,813 | |||||||||
|
Marketing and administrative expenses |
14,272 | 10,711 | 13,025 | |||||||||
|
Income from operations |
5,507 | 8,700 | 10,788 | |||||||||
|
Other income (expense): |
||||||||||||
|
Interest expense |
(162 | ) | (68 | ) | (58 | ) | ||||||
|
Interest income |
79 | 134 | 69 | |||||||||
|
Foreign exchange (loss) gain |
(3 | ) | 26 | (62 | ) | |||||||
|
Other - net |
- | 4 | 7 | |||||||||
|
Income before income tax expense |
5,421 | 8,796 | 10,744 | |||||||||
|
Income tax expense |
2,400 | 3,224 | 3,915 | |||||||||
|
Net income |
$ | 3,021 | $ | 5,572 | $ | 6,829 | ||||||
|
Weighted average shares outstanding: |
||||||||||||
|
Basic |
10,072 | 10,013 | 10,017 | |||||||||
|
Effect of dilutive securities |
7 | 28 | 21 | |||||||||
|
Diluted |
10,079 | 10,041 | 10,038 | |||||||||
|
Earnings per share: |
||||||||||||
|
Basic |
$ | 0.30 | $ | 0.56 | $ | 0.68 | ||||||
|
Diluted |
$ | 0.30 | $ | 0.55 | $ | 0.68 | ||||||
|
Cash dividends declared per share |
$ | 0.32 | $ | 0.72 | $ | 0.57 | ||||||
See notes consolidated financial statements.
CROWN CRAFTS, INC. AND SUBSIDIARIES
CONSOLIDATED STATEMENTS OF CHANGES IN SHAREHOLDERS' EQUITY
FISCAL YEARS ENDED APRIL 1, 2018, APRIL 2, 2017 AND APRIL 3, 2016
|
Common Shares |
Treasury Shares |
|||||||||||||||||||||||||||
|
Number of Shares |
Amount |
Number of Shares |
Amount |
Additional Paid-in Capital |
Retained Earnings (Accumulated Deficit) |
Total Shareholders' Equity |
||||||||||||||||||||||
|
(Dollar amounts in thousands) |
||||||||||||||||||||||||||||
|
Balances - March 29, 2015 |
12,030,302 | $ | 120 | (1,964,886 | ) | $ | (8,390 | ) | $ | 48,561 | $ | (719 | ) | $ | 39,572 | |||||||||||||
|
Issuance of shares |
221,532 | 3 | 983 | 986 | ||||||||||||||||||||||||
|
Stock-based compensation |
906 | 906 | ||||||||||||||||||||||||||
|
Net tax effect of stock-based compensation |
273 | 273 | ||||||||||||||||||||||||||
|
Acquisition of treasury stock |
(337,305 | ) | (2,838 | ) | (2,838 | ) | ||||||||||||||||||||||
|
Net income |
6,829 | 6,829 | ||||||||||||||||||||||||||
|
Dividends declared on common stock - $0.57 per share |
(5,709 | ) | (5,709 | ) | ||||||||||||||||||||||||
|
Balances - April 3, 2016 |
12,251,834 | $ | 123 | (2,302,191 | ) | $ | (11,228 | ) | $ | 50,723 | $ | 401 | $ | 40,019 | ||||||||||||||
|
Issuance of shares |
171,705 | 1 | 893 | 894 | ||||||||||||||||||||||||
|
Stock-based compensation |
604 | 604 | ||||||||||||||||||||||||||
|
Acquisition of treasury stock |
(98,875 | ) | (947 | ) | (947 | ) | ||||||||||||||||||||||
|
Net income |
5,572 | 5,572 | ||||||||||||||||||||||||||
|
Dividends declared on common stock - $0.72 per share |
(7,219 | ) | (7,219 | ) | ||||||||||||||||||||||||
|
Balances - April 2, 2017 |
12,423,539 | 124 | (2,401,066 | ) | (12,175 | ) | 52,220 | (1,246 | ) | 38,923 | ||||||||||||||||||
|
Issuance of shares |
70,250 | 1 | 115 | 116 | ||||||||||||||||||||||||
|
Stock-based compensation |
539 | 539 | ||||||||||||||||||||||||||
|
Acquisition of treasury stock |
(6,959 | ) | (56 | ) | (56 | ) | ||||||||||||||||||||||
|
Net income |
3,021 | 3,021 | ||||||||||||||||||||||||||
|
Dividends declared on common stock - $0.32 per share |
(3,225 | ) | (3,225 | ) | ||||||||||||||||||||||||
|
Balances - April 1, 2018 |
12,493,789 | $ | 125 | (2,408,025 | ) | $ | (12,231 | ) | $ | 52,874 | $ | (1,450 | ) | $ | 39,318 | |||||||||||||
See notes to consolidated financial statements.
CROWN CRAFTS, INC. AND SUBSIDIARIES
CONSOLIDATED STATEMENTS OF CASH FLOWS
FISCAL YEARS ENDED APRIL 1, 2018, APRIL 2, 2017 AND APRIL 3, 2016
(amounts in thousands)
|
2018 |
2017 |
2016 |
||||||||||
|
Operating activities: |
||||||||||||
|
Net income |
$ | 3,021 | $ | 5,572 | $ | 6,829 | ||||||
|
Adjustments to reconcile net income to net cash provided by operating activities: |
||||||||||||
|
Depreciation of property, plant and equipment |
333 | 178 | 310 | |||||||||
|
Amortization of intangibles |
836 | 754 | 748 | |||||||||
|
Deferred income taxes |
708 | 697 | 165 | |||||||||
|
Loss (gain) on sale of property, plant and equipment |
2 | 5 | (15 | ) | ||||||||
|
Reserve for unrecognized tax benefits |
329 | 199 | 211 | |||||||||
|
Stock-based compensation |
539 | 604 | 906 | |||||||||
|
Tax shortfall from stock-based compensation |
- | - | (5 | ) | ||||||||
|
Changes in assets and liabilities: |
||||||||||||
|
Accounts receivable |
(2,884 | ) | 5,182 | 1,575 | ||||||||
|
Inventories |
297 | (1,036 | ) | 683 | ||||||||
|
Prepaid expenses |
655 | (94 | ) | 217 | ||||||||
|
Other assets |
19 | 54 | (60 | ) | ||||||||
|
Accounts payable |
(1,702 | ) | 509 | 168 | ||||||||
|
Accrued liabilities |
300 | (2,235 | ) | (716 | ) | |||||||
|
Net cash provided by operating activities |
2,453 | 10,389 | 11,016 | |||||||||
|
Investing activities: |
||||||||||||
|
Capital expenditures for property, plant and equipment |
(221 | ) | (191 | ) | (232 | ) | ||||||
|
Proceeds from sale of property, plant and equipment |
- | - | 31 | |||||||||
|
Payment for acquisitions, net of liabilities assumed |
(15,245 | ) | - | (123 | ) | |||||||
|
Net cash used in investing activities |
(15,466 | ) | (191 | ) | (324 | ) | ||||||
|
Financing activities: |
||||||||||||
|
Repayments under revolving line of credit |
(15,913 | ) | - | - | ||||||||
|
Borrowings under revolving line of credit |
25,371 | - | - | |||||||||
|
Purchase of treasury stock |
(56 | ) | (947 | ) | (2,838 | ) | ||||||
|
Issuance of common stock |
- | 786 | 846 | |||||||||
|
Excess tax benefit from stock-based compensation |
- | - | 278 | |||||||||
|
Payments on capital leases |
(845 | ) | - | - | ||||||||
|
Dividends paid |
(3,221 | ) | (9,719 | ) | (3,211 | ) | ||||||
|
Net cash provided by (used in) financing activities |
5,336 | (9,880 | ) | (4,925 | ) | |||||||
|
Net (decrease) increase in cash and cash equivalents |
(7,677 | ) | 318 | 5,767 | ||||||||
|
Cash and cash equivalents at beginning of period |
7,892 | 7,574 | 1,807 | |||||||||
|
Cash and cash equivalents at end of period |
$ | 215 | $ | 7,892 | $ | 7,574 | ||||||
|
Supplemental cash flow information: |
||||||||||||
|
Income taxes paid |
$ | 1,671 | $ | 3,037 | $ | 4,107 | ||||||
|
Interest paid |
67 | 2 | 56 | |||||||||
|
Noncash financing activities: |
||||||||||||
|
Dividends declared but unpaid |
(807 | ) | (803 | ) | (3,303 | ) | ||||||
|
Compensation paid as common stock |
116 | 108 | 140 | |||||||||
See notes to consolidated financial statements.
Crown Crafts, Inc. and Subsidiaries
Notes to Consolidated Financial Statements
Note 1 – Description of Business
Crown Crafts, Inc. (the “Company”) operates indirectly through its wholly-owned subsidiaries, Hamco, Inc. (“Hamco”), Carousel Designs, LLC (“Carousel”) and Crown Crafts Infant Products, Inc. (“CCIP”), in the infant, toddler and juvenile products segment within the consumer products industry. The infant, toddler and juvenile products segment consists of infant and toddler bedding and blankets, bibs, soft bath products, disposable products, developmental toys and accessories. Sales of the Company’s products are generally made directly to retailers, which are primarily mass merchants, mid-tier retailers, juvenile specialty stores, value channel stores, grocery and drug stores, restaurants, wholesale clubs and internet-based retailers, as well as directly to consumers through www.babybedding.com. The Company’s products marketed under a variety of Company-owned trademarks, under trademarks licensed from others and as private label goods.
Note 2 - Summary of Significant Accounting Policies
Basis of Presentation: The accompanying consolidated financial statements include the accounts of the Company and have been prepared pursuant to accounting principles generally accepted in the U.S. (“GAAP”) as promulgated by the Financial Accounting Standards Board (“FASB”). References herein to GAAP are to topics within the FASB Accounting Standards Codification (the “FASB ASC”), which the FASB periodically revises through the issuance of an Accounting Standards Update (“ASU”) and which has been established by the FASB as the authoritative source for GAAP recognized by the FASB to be applied by nongovernmental entities.
Reclassifications: The Company has classified certain prior year information to conform to the amounts presented in the current year. None of the changes impact the Company's previously reported financial position or results of operations.
Fiscal Year: The Company's fiscal year ends on the Sunday nearest to or on March 31. References herein to “fiscal year 2018” or “2018” represent the 52-week period ended April 1, 2018, references to “fiscal year 2017” or “2017” represent the 52-week period ended April 2, 2017 and references to “fiscal year 2016” or “2016” represent the 53-week period ended April 3, 2016.
Use of Estimates: The preparation of financial statements in conformity with GAAP requires management to make estimates and assumptions that affect the reported amounts of assets and liabilities and disclosure of contingent assets and liabilities as of the date of the consolidated balance sheets and the reported amounts of revenues and expenses during the periods presented on the consolidated statements of income and cash flows. Significant estimates are made with respect to the allowances related to accounts receivable for customer deductions for returns, allowances and disputes. The Company also has a certain amount of discontinued finished goods which necessitates the establishment of inventory reserves that are highly subjective. Actual results could differ materially from those estimates.
Cash and Cash Equivalents: The Company considers all highly-liquid investments purchased with original maturities of three months or less to be cash equivalents. The Company’s credit facility consists of a revolving line of credit under a financing agreement with The CIT Group/Commercial Services, Inc. (“CIT”), a subsidiary of CIT Group Inc. The Company classifies a negative balance outstanding under this revolving line of credit as cash, as these amounts are legally owed to the Company and are immediately available to be drawn upon by the Company.
Financial Instruments: For short-term instruments such as cash and cash equivalents, accounts receivable and accounts payable, the Company uses carrying value as a reasonable estimate of fair value.
Segments and Related Information: The Company operates primarily in one principal segment, infant and toddler products. These products consist of infant and toddler bedding, bibs, soft bath products, disposable products and accessories. Net sales of bedding, blankets and accessories and net sales of bibs, bath and disposable products for fiscal years 2018, 2017 and 2016 are as follows (in thousands):
|
2018 |
2017 |
2016 |
||||||||||
|
Bedding, blankets and accessories |
$ | 43,486 | $ | 42,381 | $ | 59,020 | ||||||
|
Bibs, bath, developmental toy, feeding, baby care and disposable products |
26,784 | 23,597 | 25,322 | |||||||||
|
Total net sales |
$ | 70,270 | $ | 65,978 | $ | 84,342 | ||||||
Other Accrued Liabilities: An amount of $540,000 was recorded as other accrued liabilities as of April 1, 2018. Of this amount, $292,000 reflected unearned revenue recorded for payments from customers that were received before products were shipped. Other accrued liabilities as of April 1, 2018 also includes a reserve for customer returns of $8,000 and unredeemed store credits and gift certificates totaling $22,000. The Company reduces its liabilities for store credits and gift certificates, and recognizes the associated revenue, at the earlier of their redemption by customers, their expiration or when their likelihood of redemption becomes remote, generally two years from the date of issuance.
Revenue Recognition: Sales made directly to consumers are recorded when shipped products have been received by customers. Sales made to retailers are recorded when products are shipped to customers and are reported net of anticipated returns, which are estimated based on historical rates, and other allowances in the accompanying consolidated statements of income. Reserves for returns and other allowances, including cooperative advertising allowances, warehouse allowances, placement fees and volume rebates, are recorded commensurate with sales activity or using the straight-line method, as appropriate, and the cost of such allowances is netted against sales in reporting the results of operations. Shipping costs are included in cost of products sold.
Allowances Against Accounts Receivable: The Company’s allowances against accounts receivable are primarily contractually agreed-upon deductions for items such as cooperative advertising and warehouse allowances, placement fees and volume rebates. These deductions are recorded throughout the year commensurate with sales activity or using the straight-line method, as appropriate. Funding of the majority of the Company’s allowances occurs on a per-invoice basis. The allowances for customer deductions, which are netted against accounts receivable in the accompanying consolidated balance sheets, consist of agreed-upon cooperative advertising support, placement fees, markdowns and warehouse and other allowances. All such allowances are recorded as direct offsets to sales, and such costs are accrued commensurate with sales activities or as a straight-line amortization charge of an agreed-upon fixed amount, as appropriate to the circumstances for each arrangement. When a customer requests deductions, the allowances are reduced to reflect such payments or credits issued against the customer’s account balance. The Company analyzes the components of the allowances for customer deductions monthly and adjusts the allowances to the appropriate levels. The timing of the funding requests for advertising support can cause the net balance in the allowance account to fluctuate from period to period. The timing of such funding requests should have a minimal impact on the consolidated statements of income since such costs are accrued commensurate with sales activity or using the straight-line method, as appropriate.
To reduce its exposure to credit losses, the Company assigns the majority of its trade accounts receivable under factoring agreements with CIT. In the event a factored receivable becomes uncollectible due to creditworthiness, CIT bears the risk of loss. The Company’s management must make estimates of the uncollectiblity of its non-factored accounts receivable, which it accomplishes by specifically analyzing accounts receivable, historical bad debts, customer concentrations, customer creditworthiness, current economic trends and changes in its customers’ payment terms. On September 18, 2017, Toys “R” Us, Inc. (“TRU”) filed a voluntary petition for relief under Chapter 11 of Title 11 of the U.S. Bankruptcy Code with the U.S. Bankruptcy Court for the Eastern District of Virginia, Richmond Division (the “Court”). On March 14, 2018, TRU filed a motion with the Court seeking authority to close its remaining stores and distribution centers in the U.S., and to otherwise discontinue, liquidate and wind-down all U.S. operations.
As described below in Note 3 – Financing Arrangements, the Company entered into a series of agreements with JPMorgan Chase Bank, N.A. (“Chase”) wherein the Company had the right to sell, and Chase had the obligation to purchase, certain claims that could arise if accounts receivable amounts owed by an affiliate company of TRU to the Company became uncollectible (subject to certain specified limits). As a result of the TRU bankruptcy and liquidation, the Company during fiscal year 2018 exercised its rights under these agreements and simultaneously recorded and charged off provisions for doubtful accounts for a portion of the amounts owed that were in excess of the limits covered by the agreements that the Company estimated to be uncollectible in the amount of $218,000. The Company did not record a provision for doubtful accounts for either of fiscal years 2017 or 2016.
The Company’s accounts receivable at April 1, 2018 amounted to $18.5 million, net of allowances of $565,000. Of this amount, $15.4 million was due from CIT under the factoring agreements, which amount represents the maximum loss that the Company could incur if CIT failed completely to perform its obligations under the factoring agreements.
Inventory Valuation: The preparation of the Company's financial statements requires careful determination of the appropriate value of the Company's inventory balances. Such amounts are presented as a current asset in the accompanying consolidated balance sheets and are a direct determinant of cost of products sold in the accompanying consolidated statements of income and, therefore, have a significant impact on the amount of net income reported in the accounting periods. The basis of accounting for inventories is cost, which includes the direct supplier acquisition cost, duties, taxes and freight, and the indirect costs to design, develop, source and store the product until it is sold. Once cost has been determined, the Company’s inventory is then stated at the lower of cost or net realizable value, with cost determined using the first-in, first-out ("FIFO") method, which assumes that inventory quantities are sold in the order in which they are acquired, and the average cost method for a portion of the Company’s inventory.
The determination of the indirect charges and their allocation to the Company's finished goods inventories is complex and requires significant management judgment and estimates. If management made different judgments or utilized different estimates, then differences would result in the valuation of the Company's inventories and in the amount and timing of the Company's cost of products sold and the resulting net income for the reporting period.
On a periodic basis, management reviews its inventory quantities on hand for obsolescence, physical deterioration, changes in price levels and the existence of quantities on hand which may not reasonably be expected to be sold within the Company’s normal operating cycle. To the extent that any of these conditions is believed to exist or the market value of the inventory expected to be realized in the ordinary course of business is otherwise no longer as great as its carrying value, an allowance against the inventory value is established. To the extent that this allowance is established or increased during an accounting period, an expense is recorded in cost of products sold in the Company's consolidated statements of income. Only when inventory for which an allowance has been established is later sold or is otherwise disposed is the allowance reduced accordingly. Significant management judgment is required in determining the amount and adequacy of this allowance. In the event that actual results differ from management's estimates or these estimates and judgments are revised in future periods, the Company may not fully realize the carrying value of its inventory or may need to establish additional allowances, either of which could materially impact the Company's financial position and results of operations.
Depreciation and Amortization: The accompanying consolidated balance sheets reflect property, plant and equipment, and certain intangible assets at cost less accumulated depreciation or amortization. The Company capitalizes additions and improvements and expenses maintenance and repairs as incurred. Depreciation and amortization are computed using the straight-line method over the estimated useful lives of the assets, which are three to eight years for property, plant and equipment, and five to twenty years for intangible assets other than goodwill. The Company amortizes improvements to its leased facilities over the term of the lease or the estimated useful life of the asset, whichever is shorter.
Valuation of Long-Lived Assets and Identifiable Intangible Assets: In addition to the depreciation and amortization procedures set forth above, the Company reviews for impairment long-lived assets and certain identifiable intangible assets whenever events or changes in circumstances indicate that the carrying amount of any asset may not be recoverable. In the event of impairment, the asset is written down to its fair market value.
Patent Costs: The Company incurs certain legal and related costs in connection with patent applications. The Company capitalizes such costs to be amortized over the expected life of the patent to the extent that an economic benefit is anticipated from the resulting patent or an alternative future use is available to the Company. The Company also capitalizes legal and other costs incurred in the protection or defense of the Company’s patents when it is believed that the future economic benefit of the patent will be maintained or increased and a successful defense is probable. Capitalized patent defense costs are amortized over the remaining expected life of the related patent. The Company’s assessment of future economic benefit of its patents involves considerable management judgment, and a different conclusion could result in a material impairment charge up to the carrying value of these assets.
Purchase Price Allocations and the Resulting Goodwill: The Company's strategy includes, when appropriate, entering into transactions accounted for as business combinations. In connection with a business combination, the Company prepares an allocation of the cost of the acquisition to the identifiable assets acquired and liabilities assumed, based on estimated fair values as of the acquisition date. The excess of the purchase price over the estimated fair value of the identifiable net assets acquired is recorded as goodwill.
The amount of goodwill recorded in a business combination can vary significantly depending upon the values attributed to the assets acquired and liabilities assumed. Although goodwill has no useful life and is not subject to a systematic annual amortization against earnings, the Company performs a measurement for impairment of the carrying value of its goodwill annually on the first day of the Company’s fiscal year. An additional impairment test is performed during the year whenever an event or change in circumstances suggest that the fair value of the goodwill of either of the reporting units of the Company has more likely than not fallen below its carrying value. The annual or interim measurement for impairment of goodwill is performed at the reporting unit level. A reporting unit is either an operating segment or one level below an operating segment. In its annual or interim measurement for impairment of goodwill, the Company conducts a qualitative assessment by examining relevant events and circumstances which could have a negative impact on the Company’s goodwill, which includes macroeconomic conditions, industry and market conditions, commodity prices, cost factors, overall financial performance, reporting unit dispositions and acquisitions, the market capitalization of the Company and other relevant events specific to the Company.
If, after assessing the totality of events or circumstances described above, the Company determines that it is more likely than not that the fair value of either of the Company's reporting units is less than its carrying amount, the two-step goodwill test is performed. The two-step goodwill impairment test is also performed whenever events or changes in circumstances indicate that the carrying value may not be recoverable. If, after performing the two-step goodwill test, it is determined that the carrying value of goodwill is impaired, the amount of goodwill is reduced and a corresponding charge is made to earnings in the period in which the goodwill is determined to be impaired.
Advertising Costs: The Company’s advertising costs are primarily associated with cooperative advertising arrangements with certain of the Company’s customers and are recognized using the straight-line method based upon aggregate annual estimated amounts for these customers, with periodic adjustments to the actual amounts of authorized agreements. Costs associated with advertising on websites such as Facebook and Google and which are associated with the Company’s online business are recorded as incurred. Advertising expense is included in other marketing and administrative expenses in the consolidated statements of income and amounted to $1.3 million, $742,000 and $931,000 for fiscal years 2018, 2017 and 2016, respectively.
Provision for Income Taxes: The Company’s provision for income taxes includes all currently payable federal, state, local and foreign taxes and is based upon the Company’s estimated annual effective tax rate, which is based on the Company’s forecasted annual pre-tax income, as adjusted for certain expenses within the consolidated statements of income that will never be deductible on the Company’s tax returns and certain charges expected to be deducted on the Company’s tax returns that will never be deducted on the consolidated statements of income, multiplied by the statutory tax rates for the various jurisdictions in which the Company operates and reduced by certain anticipated tax credits.
The Company files income tax returns in the many jurisdictions in which it operates, including the U.S., several U.S. states and the People’s Republic of China. The statute of limitations varies by jurisdiction; tax years open to federal or state audit or other adjustment as of April 1, 2018 were the tax years ended April 1, 2018, April 2, 2017, April 3, 2016, March 29, 2015, March 30, 2014, March 31, 2013, April 1, 2012 and April 3, 2011.
The Company’s policy is to recognize the effect that a change in enacted tax rates would have on net deferred income tax assets and liabilities in the period in which the tax rates are changed. On December 22, 2017, the President of the United States signed into law comprehensive tax legislation commonly referred to as the Tax Cuts and Jobs Act (the “TCJA”), which includes a provision to lower the federal corporate income tax rate to 21% effective as of January 1, 2018. Because the Company’s fiscal year 2018 ended on April 1, 2018, the lower corporate income tax rate was phased in, resulting in a blended federal statutory rate of 30.75% for fiscal 2018.
The Company’s policy is to provide for deferred income taxes based on the difference between the financial statement and tax bases of assets and liabilities using enacted tax rates that will be in effect when the differences are expected to reverse. The Company has recognized the effect of the TCJA on the Company’s net deferred income tax assets, which as of October 2, 2017 and April 2, 2017 had been recorded based upon the pre-TCJA enacted composite federal, state and foreign income tax rate of approximately 37.5% that would have been applied as the financial statement and tax differences began to reverse. Because most of these differences are now estimated to reverse at a composite rate of approximately 24.5%, the Company was required to revalue its net deferred income tax assets. This revaluation resulted in a discrete charge to income tax expense of $377,000 during fiscal year 2018.
Management evaluates items of income, deductions and credits reported on the Company’s various federal and state income tax returns filed and recognizes the effect of positions taken on those income tax returns only if those positions are more likely than not to be sustained. The Company applies the provisions of FASB ASC Sub-topic 740-10-25, which requires a minimum recognition threshold that a tax benefit must meet before being recognized in the financial statements. Recognized income tax positions are measured at the largest amount that has a greater than 50% likelihood of being realized. Changes in recognition or measurement are reflected in the period in which the change in judgment occurs.
During fiscal year 2016, an evaluation was made of the Company’s process regarding the calculation of the state portion of its income tax provision. This evaluation resulted in a tax position that reflects opportunities for the application of more favorable state apportionment percentages for several prior fiscal years. After considering all relevant information, the Company believes that the technical merits of this tax position would more likely than not be sustained. However, the Company also believes that the ultimate resolution of the tax position will result in a tax benefit that is less than the full amount being sought. Therefore, the Company’s measurement regarding the tax impact of the revised state apportionment percentages resulted in the Company recording during fiscal years 2018 and 2017 reserves for unrecognized tax benefits of $113,000 and $134,000, respectively, in the accompanying consolidated financial statements. During fiscal year 2016, the Company recorded a gross reserve for unrecognized tax benefits of $773,000, less an offset of $573,000 to reflect state income tax overpayments net of the federal income tax impact, for a net reserve for unrecognized tax benefits of $200,000. Because the tax impact of the revised state apportionment percentages are measured net of federal income taxes, the provision in the TCJA that lowered the federal corporate income tax rate to 21% required the Company to revalue its reserve for unrecognized tax benefits. This revaluation resulted in a net discrete charge to income tax expense of $120,000 during fiscal year 2018.
The Company’s policy is to accrue interest expense and penalties as appropriate on any estimated unrecognized tax benefits as a charge to interest expense in the Company’s consolidated statements of income. During fiscal years 2018, 2017 and 2016, the Company accrued $96,000, $65,000 and $11,000, respectively, for interest expense and penalties on the portion of the unrecognized tax benefit that has been refunded to the Company but for which the relevant statute of limitations remained unexpired. No interest expense or penalties are accrued with respect to estimated unrecognized tax benefits that are associated with state income tax overpayments that remain receivable.
In December 2016, the Company received notification from the State of California of its intention to examine the Company’s consolidated income tax returns for the fiscal years ended March 30, 2014, March 31, 2013, April 1, 2012 and April 3, 2011. The ultimate resolution of the examination could include administrative or legal proceedings. Although management believes that the calculations and positions taken on these and all other filed income tax returns are reasonable and justifiable, the outcome of this or any other examination could result in an adjustment to the position that the Company took on such income tax returns. Such adjustment could also lead to adjustments to one or more other state income tax returns, or to income tax returns for subsequent fiscal years, or both. To the extent that the Company’s reserve for unrecognized tax benefits is not adequate to support the cumulative effect of such adjustments, the Company could experience a material adverse impact on its future results of operations. Conversely, to the extent that the calculations and positions taken by the Company on the filed income tax returns under examination are sustained, the reversal of all or a portion of the Company’s reserve for unrecognized tax benefits could result in a favorable impact on its future results of operations.
Royalty Payments: The Company has entered into agreements that provide for royalty payments based on a percentage of sales with certain minimum guaranteed amounts. These royalties are accrued based upon historical sales rates adjusted for current sales trends by customers. Royalty expense is included in cost of products sold and amounted to $7.2 million, $7.0 million and $9.0 million for fiscal years 2018, 2017 and 2016, respectively.
Earnings Per Share: The Company calculates basic earnings per share by using a weighted average of the number of shares outstanding during the reporting periods. Diluted shares outstanding are calculated in accordance with the treasury stock method, which assumes that the proceeds from the exercise of all exercisable options would be used to repurchase shares at market value. The net number of shares issued after the exercise proceeds are exhausted represents the potentially dilutive effect of the exercisable options, which are added to basic shares to arrive at diluted shares.
Recently Issued Accounting Standards: On May 28, 2014, the FASB issued ASU No. 2014-09, Revenue from Contracts with Customers (Topic 606), which will replace most existing GAAP guidance on revenue recognition and which will require the use of more estimates and judgments, as well as additional disclosures. When issued, ASU No. 2014-09 was to become effective in the fiscal year beginning after December 15, 2016, but on August 12, 2015 the FASB issued ASU No. 2015-14, Revenue from Contracts with Customers (Topic 606): Deferral of the Effective Date, which provided for a one-year deferral of ASU No. 2014-09. Early adoption was originally not permitted in ASU No. 2014-09, but ASU No. 2015-14 permits early adoption in the first interim period of the fiscal year beginning after December 15, 2016.
ASU No. 2014-09 will require revenue to be recognized by an entity when a customer obtains control of promised products in an amount that reflects the consideration the entity expects to receive in exchange for those products and permits the use of either the retrospective or modified retrospective method. The Company expects to adopt ASU No. 2014-09 on April 2, 2018 on a modified retrospective basis. The Company has evaluated the guidance of ASU No. 2014-09 against its existing accounting policies and practices related to revenue recognition, including a review of customer purchase orders, invoices, shipping terms and other contractual agreements with customers. Based upon this evaluation, the Company does not expect that the adoption of ASU No. 2014-09 will have a material impact on the Company’s financial position or the amount or timing of its recognition of revenue. The Company anticipates that the disclosures related to its accounting policies and practices associated with revenue recognition will be enhanced.
On July 22, 2015, the FASB issued ASU No. 2015-11, Inventory (Topic 330): Simplifying the Measurement of Inventory, which will clarify that after an entity determines the cost of its inventory, the subsequent measurement and presentation of such inventory should be at the lower of cost or net realizable value. The ASU will become effective for the first interim period of the fiscal year beginning after December 15, 2016. The ASU should be applied prospectively, and early adoption is permitted. The Company adopted ASU No. 2015-11 on April 3, 2017, and has determined that the adoption of the ASU did not have a material effect on its financial position, results of operations and related disclosures.
On February 25, 2016, the FASB issued ASU No. 2016-02, Leases (Topic 842), which will increase transparency and comparability by requiring an entity to recognize lease assets and lease liabilities on its balance sheet and by requiring the disclosure of key information about leasing arrangements. Under the provisions of ASU No. 2016-02, the Company will be required to capitalize most of its current operating lease obligations as right-of-use assets with corresponding liabilities based upon the present value of the future cash outflows associated with such operating lease obligations. The ASU will become effective for the first interim period of the fiscal year beginning after December 15, 2018. The ASU is to be applied using a modified retrospective approach, and early adoption is permitted. The Company is currently evaluating the effect that the adoption of ASU No. 2016-02 will have on its financial position, results of operations and related disclosures.
On June 16, 2016, the FASB issued ASU No. 2016-13, Financial Instruments – Credit Losses (Topic 326): Measurement of Credit Losses on Financial Instruments, the objective of which is to provide financial statement users with more information about the expected credit losses on financial instruments and other commitments to extend credit held by an entity. Current GAAP requires an “incurred loss” methodology for recognizing credit losses that delays recognition until it is probable that a loss has been incurred. Because this methodology restricted the recognition of credit losses that are expected, but did not yet meet the “probable” threshold, ASU No. 2016-13 was issued to require the consideration of a broader range of reasonable and supportable information when determining estimates of credit losses. The ASU will become effective for the first interim period of the fiscal year beginning after December 15, 2019. The ASU is to be applied using a modified retrospective approach, and the ASU may be early-adopted as of the first interim period of the fiscal year beginning after December 15, 2018. Although the Company has not determined the full impact of the adoption of ASU No. 2016-13, because the Company assigns the majority of its trade accounts receivable under factoring agreements with CIT, the Company does not believe that the adoption of ASU No. 2016-13 will have a significant impact on the Company’s financial position, results of operations and related disclosures.
On January 26, 2017, the FASB issued ASU No. 2017-04, Intangibles – Goodwill and Other (Topic 350): Simplifying the Test for Goodwill Impairment. Under previous GAAP, the test for the impairment of goodwill was performed by first assessing qualitative factors to determine whether it was more likely than not that the fair value of a reporting unit was less than its carrying amount. If such qualitative factors so indicated, then the impairment test was continued in a two-step approach. The first step was the estimation of the fair value of each reporting unit to ensure that its fair value exceeded its carrying value. If step one indicated that a potential impairment existed, then the second step was performed to measure the amount of an impairment charge, if any. In the second step, these estimated fair values were used as the hypothetical purchase price for the reporting units, and an allocation of such hypothetical purchase price was made to the identifiable tangible and intangible assets and assigned liabilities of the reporting units. The impairment charge was calculated as the amount, if any, by which the carrying value of the goodwill exceeded the implied amount of goodwill that resulted from this hypothetical purchase price allocation.
The intent of ASU No. 2017-04 was to simplify the process of measuring goodwill for impairment by eliminating the second step from the goodwill impairment test. Instead, an entity should perform its annual or interim measurement of goodwill for impairment by comparing the estimated fair value of each reporting unit of the entity with its carrying value. If the carrying value of a reporting unit of an entity exceeds its estimated fair value, then an impairment charge is calculated as the difference between the carrying value of the reporting unit and its estimated fair value, not to exceed the goodwill of the reporting unit. The ASU is to be applied on a prospective basis and was to have become effective for the first interim period of the fiscal year beginning after December 15, 2019, but it could have been early-adopted as of the date of the first interim or annual measurement of goodwill for impairment performed on or after January 1, 2017. The Company elected to early-adopt ASU No. 2017-04 effective as of April 3, 2017, which did not have an impact on its financial position or results of operations.
The Company has determined that all other ASU’s issued which had become effective as of May 10, 2018, or which will become effective at some future date, are not expected to have a material impact on the Company’s consolidated financial statements.
Note 3 - Financing Arrangements
Master Stand-by Claims Purchase Agreements: On May 16, 2017, the Company entered into an agreement (the “First Agreement”) with Chase wherein the Company had the right to sell, and Chase had the obligation to purchase, certain claims that could arise if accounts receivable amounts owed by Toys R Us-Delaware, Inc. (“Toys-Delaware”), an affiliated company of TRU, to the Company became uncollectible. The First Agreement would have expired on September 20, 2018 and carried a fee of 1.65% per month of the limit of $1.8 million of accounts receivable due from Toys-Delaware. On September 18, 2017, TRU and Toys-Delaware filed voluntary petitions for relief under Chapter 11 of Title 11 of the U.S. Bankruptcy Code (the “Bankruptcy Filing”). Pursuant to the terms of the First Agreement, the Bankruptcy Filing allowed the Company to exercise its right to sell to Chase the claim that arose as a result of the Bankruptcy Filing, which amounted to $866,000 payable to the Company (the “First Exercise”). Of this amount, $755,000 remained payable to the Company by Chase as of April 1, 2018 under customary closing procedures and has been classified as other accounts receivable in the accompanying consolidated balance sheets. The First Exercise resulted in the acceleration of the recognition of the remaining unpaid fees owed under the First Agreement. During fiscal year 2018, the Company recognized $480,000 in fees under the First Agreement, which are included in marketing and administrative expenses in the accompanying consolidated statements of income.
On September 19, 2017, the Company entered into an agreement (the “Second Agreement”) with Chase wherein the Company has the right to sell, and Chase has the obligation to purchase, certain accounts receivable claims that could arise if Toys-Delaware converts its Chapter 11 case to Chapter 7 of the U.S. Bankruptcy Code or takes certain other specified actions. The Second Agreement would have expired on March 31, 2018 and carried a fee of 1.50% per month of the limit of $1.8 million of accounts receivable due from Toys-Delaware. On March 14, 2018, TRU filed a motion with the Court seeking authority to close the remaining Toys-Delaware stores and distribution centers in the U.S., and to otherwise discontinue, liquidate and wind-down all U.S. operations of Toys-Delaware.
Pursuant to the terms of the Second Agreement, the liquidation filing allowed the Company to exercise its right to sell to Chase the claim under the Second Agreement that arose as a result of the liquidation filing, which amounted to $1.8 million. This amount remained payable to the Company by Chase as of April 1, 2018 under customary closing procedures and has been classified as other accounts receivable in the accompanying consolidated balance sheets. During fiscal year 2018, the Company recognized $173,000 in fees under the Second Agreement, which are included in marketing and administrative expenses in the accompanying consolidated statements of income.
Factoring Agreements: The Company assigns the majority of its trade accounts receivable to CIT pursuant to factoring agreements, which have expiration dates that are coterminous with that of the financing agreement described below. Under the terms of the factoring agreements, CIT remits customer payments to the Company as such payments are received by CIT. Credit losses are borne by CIT with respect to assigned accounts receivable from approved shipments, while the Company bears the responsibility for adjustments from customers related to returns, allowances, claims and discounts. CIT may at any time terminate or limit its approval of shipments to a particular customer. If such a termination or limitation occurs, the Company either assumes (and may seek to mitigate) the credit risk for shipments to the customer after the date of such termination or limitation or discontinues shipments to the customer. Factoring fees, which are included in marketing and administrative expenses in the accompanying consolidated statements of income, were $223,000, $395,000 and $556,000 during fiscal years 2018, 2017 and 2016, respectively. There were no advances on the factoring agreements at either April 2, 2017 or April 3, 2016.
Credit Facility: The Company’s credit facility at April 1, 2018 consisted of a revolving line of credit under a financing agreement with CIT of up to $26.0 million, which includes a $1.5 million sub-limit for letters of credit, bearing interest at the rate of prime minus 0.5% or LIBOR plus 2.0%. The financing agreement matures on July 11, 2019 and is secured by a first lien on all assets of the Company. As of April 1, 2018, the Company had elected to pay interest on balances owed under the revolving line of credit under the LIBOR option, which was 3.67% as of April 1, 2018. The financing agreement also provides for the payment by CIT to the Company of interest at the rate of prime as of the beginning of the calendar month minus 2.0%, which was 2.75% as of April 1, 2018, on daily negative balances, if any, held at CIT.
The financing agreement as in effect prior to December 28, 2015 provided for a monthly fee, which was assessed based on 0.125% of the average unused portion of the revolving line of credit, less any outstanding letters of credit (the “Commitment Fee”). The Commitment Fee amounted to $25,000 during fiscal year 2016. The financing agreement was amended on December 28, 2015 to eliminate the Commitment Fee. As of April 1, 2018, there was a balance of $9.5 million owed on the revolving line of credit, the entirety of which will mature during fiscal year 2020. There was no letter of credit outstanding and $13.2 million was available under the revolving line of credit based on the Company’s eligible accounts receivable and inventory balances. As of April 2, 2017, there was no balance owed on the revolving line of credit, there was no letter of credit outstanding and $21.4 million was available under the revolving line of credit based on the Company’s eligible accounts receivable and inventory balances.
The financing agreement contains usual and customary covenants for agreements of that type, including limitations on other indebtedness, liens, transfers of assets, investments and acquisitions, merger or consolidation transactions, transactions with affiliates, and changes in or amendments to the organizational documents for the Company and its subsidiaries. The Company believes it was in compliance with these covenants as of April 1, 2018.
Note 4 – Acquisitions
Carousel: On August 4, 2017, Carousel Acquisition, LLC, a newly formed subsidiary of the Company, acquired substantially all of the assets and business, and assumed certain specified liabilities, of a privately held manufacturer and online retailer of infant and toddler bedding based in Douglasville, Georgia, which was at that time named Carousel Designs, LLC (the “Carousel Acquisition”). On August 11, 2017, the seller of such assets having relinquished its rights to its name as part of the terms of the acquisition transaction, Carousel Acquisition, LLC changed its name to Carousel Designs, LLC.
The Company anticipates that certain synergies, including administrative and capital efficiencies, may be achieved as a result of the Company’s control of the combined assets and that the Company will benefit from the direct-to-consumer opportunities that will result from the Carousel Acquisition. Carousel paid an acquisition cost of $8.7 million from cash on hand and assumed certain specified liabilities relating to the business. Carousel also recognized as expense $347,000 of costs associated with the acquisition during 2018, which is included in marketing and administrative expenses in the accompanying consolidated statements of income.
The Carousel Acquisition has been accounted for in accordance with FASB ASC Topic 805, Business Combinations. The Company is currently determining the allocation of the acquisition cost with the assistance of an independent third party. The identifiable assets acquired were recorded at their estimated fair value, which has been preliminarily determined based on available information and the use of multiple valuation approaches. The estimated useful lives of the identifiable intangible assets acquired were determined based upon the remaining time that these assets are expected to directly or indirectly contribute to the future cash flow of the Company. Certain data necessary to complete the acquisition cost allocation is not yet available, including the valuation of pre-acquisition contingencies and the final appraisals and valuations of assets acquired and liabilities assumed.
The following table represents the Company’s allocation of the acquisition cost (in thousands) to the identifiable assets acquired and the liabilities assumed based on their respective estimated fair values as of the acquisition date. The excess of the acquisition cost over the estimated fair value of the identifiable net assets acquired is reflected as goodwill.
|
Tangible assets: |
||||
|
Inventory |
$ | 967 | ||
|
Prepaid expenses |
5 | |||
|
Fixed assets |
1,068 | |||
|
Total tangible assets |
2,040 | |||
|
Amortizable intangible assets: |
||||
|
Tradename |
1,100 | |||
|
Developed technology |
1,100 | |||
|
Non-compete covenants |
360 | |||
|
Total amortizable intangible assets |
2,560 | |||
|
Goodwill |
5,679 | |||
|
Total acquired assets |
10,279 | |||
|
Liabilities assumed: |
||||
|
Accounts payable |
319 | |||
|
Accrued wages and benefits |
59 | |||
|
Unearned revenue |
271 | |||
|
Other accrued liabilities |
60 | |||
|
Capital leases |
845 | |||
|
Total liabilities assumed |
1,554 | |||
|
Net acquisition cost |
$ | 8,725 |
During the purchase price measurement period, the Company recorded an adjustment to decrease amortizable intangible assets acquired by $300,000, with a corresponding offset to goodwill, based on information obtained that existed at the acquisition date. The Company expects to complete the acquisition cost allocation during the 12-month period following the acquisition date, during which time the values of the assets acquired and liabilities assumed, including the goodwill, may need to be revised as appropriate. Based upon the preliminary allocation of the acquisition cost, the Company has recognized $5.7 million of goodwill, the entirety of which has been assigned to the reporting unit of the Company that produces and markets infant and toddler bedding, blankets and accessories, and the entirety of which is expected to be deductible for income tax purposes.
In connection with the Carousel Acquisition, Carousel paid off capital leases amounting to $845,000 that were associated with certain fixed assets that were acquired. The Carousel Acquisition resulted in net sales of $5.4 million during fiscal year 2018. Carousel recorded amortization expense associated with the acquired amortizable intangible assets in the amount of $183,000 during fiscal 2018, which is included in marketing and administrative expenses in the accompanying consolidated statements of income. Amortization is computed for the acquired amortizable intangible assets using the straight-line method over the estimated useful lives of the assets, which are 15 years for the tradename, 10 years for the developed technology, 5 years for the non-compete agreements and 11 years on a weighted-average basis for the grouping taken together.
Sassy: On December 15, 2017, Hamco acquired certain assets associated with the Sassy®-branded developmental toy, feeding and baby care product line from Sassy 14, LLC and assumed certain related liabilities (the “Sassy Acquisition”). The Company anticipates that certain synergies, including administrative and capital efficiencies, may be achieved as a result of the Company’s acquisition of the Sassy product line and that the Company will benefit from the added diversity to the Company’s portfolio of products. The Company further anticipates that the Sassy Acquisition will strengthen the Company’s overall position in the infant and juvenile products market. Hamco paid an acquisition cost of $6.5 million from a combination of cash on hand and the revolving line of credit. Hamco also recognized as expense $169,000 of costs associated with the acquisition during fiscal year 2018, which is included in marketing and administrative expenses in the accompanying consolidated statements of income.
The Sassy Acquisition has been accounted for in accordance with FASB ASC Topic 805, Business Combinations. The Company is currently determining the allocation of the acquisition cost with the assistance of an independent third party. The identifiable assets acquired were recorded at their estimated fair value, which has been preliminarily determined based on available information and the use of multiple valuation approaches. The estimated useful lives of the identifiable intangible assets acquired were determined based upon the remaining time that these assets are expected to directly or indirectly contribute to the future cash flow of the Company. Certain data necessary to complete the acquisition cost allocation is not yet available, including the valuation of pre-acquisition contingencies and the final appraisals and valuations of assets acquired and liabilities assumed.
The following table represents the Company’s preliminary allocation of the acquisition cost (in thousands) to the identifiable assets acquired and the liabilities assumed based on their respective estimated fair values as of the acquisition date. The excess of the acquisition cost over the estimated fair value of the identifiable net assets acquired is reflected as goodwill.
|
Tangible assets: |
||||
|
Inventory |
$ | 3,297 | ||
|
Prepaid expenses |
120 | |||
|
Fixed assets |
383 | |||
|
Total tangible assets |
3,800 | |||
|
Amortizable intangible assets: |
||||
|
Tradename |
580 | |||
|
Customer relationships |
1,840 | |||
|
Total amortizable intangible assets |
2,420 | |||
|
Goodwill |
320 | |||
|
Total acquired assets |
6,540 | |||
|
Liabilities assumed: |
||||
|
Accrued wages |
20 | |||
|
Net acquisition cost |
$ | 6,520 |
The Company expects to complete the acquisition cost allocation during the 12-month period following the acquisition date, during which time the values of the assets acquired and liabilities assumed, including the goodwill, may need to be revised as appropriate.
Based upon the preliminary allocation of the acquisition cost, the Company has recognized $320,000 of goodwill, the entirety of which has been assigned to the reporting unit of the Company that produces and markets infant and toddler bibs, developmental toys, bath care and disposable products, and the entirety of which is expected to be deductible for income tax purposes.
The Sassy Acquisition resulted in net sales of $2.1 million of developmental toy, feeding and baby care products during 2018. Hamco recorded amortization expense associated with the amortizable intangible assets acquired in the Sassy Acquisition in the amount of $56,000 during fiscal year 2018, which is included in marketing and administrative expenses in the accompanying consolidated statements of income. Amortization is computed for the acquired amortizable intangible assets using the straight-line method over the estimated useful lives of the assets, which are 15 years for the tradename, 10 years for the customer relationships and 11 years on a weighted-average basis for the grouping taken together.
Note 5 – Retirement Plan
The Company sponsors a defined contribution retirement savings plan with a cash or deferred arrangement (the “401(k) Plan”), as provided by Section 401(k) of the Internal Revenue Code (“Code”). The 401(k) Plan covers substantially all employees, who may elect to contribute a portion of their compensation to the 401(k) Plan, subject to maximum amounts and percentages as prescribed in the Code. Each calendar year, the Company’s Board of Directors (the “Board”) determines the portion, if any, of employee contributions that will be matched by the Company. For calendar year 2015, the employer matching contributions represented an amount equal to 100% of the first 2% of employee contributions and 50% of the next 1% of employee contributions to the 401(k) Plan. For calendar years 2018, 2017 and 2016, the employer matching contributions are equal to 100% of the first 2% of employee contributions and 50% of the next 3% of employee contributions to the 401(k) Plan. If an employee separates from the Company prior to the full vesting of the funds in their account, then the unvested portion of the matching employer amount in their account is forfeited when the employee receives a distribution from their account. The Company utilizes such forfeitures as an offset to the aggregate matching contributions. The Company's matching contributions to the 401(k) Plan, net of the utilization of forfeitures, were $223,000, $252,000 and $203,000 for fiscal years 2018, 2017 and 2016, respectively.
Table of Contents
Note 6 – Goodwill, Customer Relationships and Other Intangible Assets
Goodwill: Goodwill represents the excess of the purchase price over the fair value of net identifiable assets acquired in business combinations. For the purpose of presenting and measuring for the impairment of goodwill, the Company has two reporting units: one that produces and markets infant and toddler bedding, blankets and accessories and another that produces and markets infant and toddler bibs, developmental toys, bath care and disposable products. The goodwill of the reporting units of the Company as of April 2, 2017 amounted to $24.0 million, which was increased by $5.7 million and $320,000 as a result of the Carousel Acquisition and the Sassy Acquisition, respectively, as the excess of the acquisition cost over the fair values of the identifiable tangible and intangible assets acquired. Thus, as of April 1, 2018, the goodwill of the reporting units of the Company amounted to $30.0 million, which is reflected in the consolidated balance sheets net of accumulated impairment charges of $22.9 million, for a net reported balance of $7.1 million.
Effective as of April 3, 2017, the Company adopted ASU No. 2017-04, the intent of which was to simplify the measurement of goodwill for impairment. The Company measures for impairment the goodwill within its reporting units annually as of the first day of the Company’s fiscal year. An additional interim measurement for impairment is performed during the year whenever an event or change in circumstances occurs that suggests that the fair value of either of the reporting units of the Company has more likely than not (defined as having a likelihood of greater than 50%) fallen below its carrying value. The annual or interim measurement for impairment is performed by first assessing qualitative factors to determine whether it is more likely than not that the fair value of a reporting unit is less than its carrying amount. If such qualitative factors so indicate, then the measurement for impairment is continued by calculating an estimate of the fair value of each reporting unit and comparing the estimated fair value to the carrying value of the reporting unit. If the carrying value exceeds the estimated fair value of the reporting unit, then an impairment charge is calculated as the difference between the carrying value of the reporting unit and its estimated fair value, not to exceed the goodwill of the reporting unit.
On April 3, 2017, the Company performed the annual measurement for impairment of the goodwill of its reporting units and concluded that the estimated fair value of each of the Company’s reporting units exceeded their carrying values, and thus the goodwill of the Company’s reporting units was not impaired as of that date.
Other Intangible Assets: Other intangible assets as of April 1, 2018 and April 2, 2017 consisted primarily of the fair value of identifiable assets acquired in business combinations other than tangible assets and goodwill. The gross amount and accumulated amortization of the Company’s other intangible assets as of April 1, 2018 and April 2, 2017, the amortization expense for fiscal years 2018, 2017 and 2016 and the classification of such amortization expense within the accompanying consolidated statements of income are as follows (in thousands):
|
Gross Amount |
Accumulated Amortization |
Amortization Expense Fiscal Year Ended |
||||||||||||||||||||||||||
|
April 1, |
April 2, |
April 1, |
April 2, |
April 1, |
April 2, |
April 3, |
||||||||||||||||||||||
|
2018 |
2017 |
2018 |
2017 |
2018 |
2017 |
2016 |
||||||||||||||||||||||
|
Tradename and trademarks |
$ | 3,667 | $ | 1,987 | $ | 1,270 | $ | 1,066 | $ | 204 | $ | 133 | $ | 132 | ||||||||||||||
|
Developed technology |
1,100 | - | 73 | - | 73 | - | - | |||||||||||||||||||||
|
Non-compete covenants |
458 | 98 | 122 | 67 | 55 | 7 | 7 | |||||||||||||||||||||
|
Patents |
1,601 | 1,601 | 673 | 565 | 108 | 107 | 108 | |||||||||||||||||||||
|
Customer relationships |
7,374 | 5,534 | 4,790 | 4,394 | 396 | 507 | 501 | |||||||||||||||||||||
|
Total other intangible assets |
$ | 14,200 | $ | 9,220 | $ | 6,928 | $ | 6,092 | $ | 836 | $ | 754 | $ | 748 | ||||||||||||||
|
Classification within the accompanying consolidated statements of income: |
||||||||||||||||||||||||||||
|
Cost of products sold |
$ | 7 | $ | 7 | $ | 7 | ||||||||||||||||||||||
|
Marketing and administrative expenses |
829 | 747 | 741 | |||||||||||||||||||||||||
|
Total amortization expense |
$ | 836 | $ | 754 | $ | 748 | ||||||||||||||||||||||
The Company estimates that its amortization expense will be $854,000, $854,000, $790,000, $765,000 and $689,000 in fiscal years 2019, 2020, 2021, 2022 and 2023, respectively.
Note 7 – Inventories
Major classes of inventory were as follows (in thousands):
|
April 1, 2018 |
April 2, 2017 |
|||||||
|
Raw Materials |
$ | 875 | $ | 42 | ||||
|
Work in Process |
134 | - | ||||||
|
Finished Goods |
18,779 | 15,779 | ||||||
|
Total inventory |
$ | 19,788 | $ | 15,821 | ||||
Note 8 – Stock-based Compensation
The Company has two incentive stock plans, the 2006 Omnibus Incentive Plan (the “2006 Plan”) and the 2014 Omnibus Equity Compensation Plan (the “2014 Plan”). As a result of the approval of the 2014 Plan by the Company’s stockholders at the Company’s 2014 annual meeting, grants may no longer be issued under the 2006 Plan.
The Company believes that awards of long-term, equity-based incentive compensation will attract and retain directors, officers and employees of the Company and will encourage these individuals to contribute to the successful performance of the Company, which will lead to the achievement of the Company’s overall goal of increasing stockholder value. Awards granted under the 2014 Plan may be in the form of incentive stock options, non-qualified stock options, shares of restricted or unrestricted stock, stock units, stock appreciation rights, or other stock-based awards. Awards may be granted subject to the achievement of performance goals or other conditions, and certain awards may be payable in stock or cash, or a combination of the two. The 2014 Plan is administered by the Compensation Committee of the Board, which selects eligible employees, non-employee directors and other individuals to participate in the 2014 Plan and determines the type, amount, duration (such duration not to exceed a term of ten (10) years for grants of options) and other terms of individual awards. At April 1, 2018, 672,000 shares of the Company’s common stock were available for future issuance under the 2014 Plan.
Stock-based compensation is calculated according to FASB ASC Topic 718, Compensation – Stock Compensation, which requires stock-based compensation to be accounted for using a fair-value-based measurement. During fiscal years 2018, 2017 and 2016, the Company recorded $539,000, $604,000 and $906,000 of stock-based compensation, respectively. The Company records the compensation expense associated with stock-based awards granted to individuals in the same expense classifications as the cash compensation paid to those same individuals. No stock-based compensation costs were capitalized as part of the cost of an asset as of April 1, 2018.
Stock Options: The following table represents stock option activity for fiscal years 2018, 2017 and 2016:
|
Fiscal Year Ended April 1, 2018 |
Fiscal Year Ended April 2, 2017 |
Fiscal Year Ended April 3, 2016 |
||||||||||||||||||||||
|
Weighted- |
Weighted- |
Weighted- |
||||||||||||||||||||||
|
Average |
Number of |
Average |
Number of |
Average |
Number of |
|||||||||||||||||||
|
Exercise |
Options |
Exercise |
Options |
Exercise |
Options |
|||||||||||||||||||
|
Price |
Outstanding |
Price |
Outstanding |
Price |
Outstanding |
|||||||||||||||||||
|
Outstanding at Beginning of Period |
$ | 8.35 | 322,500 | $ | 7.64 | 305,000 | $ | 6.83 | 330,000 | |||||||||||||||
|
Granted |
7.35 | 140,000 | 9.60 | 120,000 | 8.38 | 110,000 | ||||||||||||||||||
|
Exercised |
- | - | 7.67 | (102,500 | ) | 6.27 | (135,000 | ) | ||||||||||||||||
|
Forfeited |
9.05 | (67,500 | ) | - | - | - | - | |||||||||||||||||
|
Outstanding at End of Period |
7.93 | 395,000 | 8.35 | 322,500 | 7.64 | 305,000 | ||||||||||||||||||
|
Exercisable at End of Period |
7.94 | 220,000 | 7.33 | 147,500 | 6.72 | 112,500 | ||||||||||||||||||
The total intrinsic value of the stock options exercised during fiscal years 2017 and 2016 was $214,000, and $300,000, respectively. As of April 1, 2018, the intrinsic value of the outstanding and exercisable stock options was $22,000 and $15,000, respectively.
There were no options exercised during fiscal year 2018. The Company received no cash from the exercise of stock options during either fiscal year 2017, or 2016. Upon the exercise of stock options, participants may choose to surrender to the Company those shares from the option exercise necessary to satisfy the exercise amount and their income tax withholding obligations that arise from the option exercise. The effect on the cash flow of the Company from these “cashless” option exercises is that the Company remits cash on behalf of the participant to satisfy his or her income tax withholding obligations. The Company used cash of $75,000 and $118,000 to remit the required income tax withholding amounts from “cashless” option exercises during fiscal years 2017 and 2016, respectively.
Because the cash remitted on behalf of the participant to satisfy his or her income tax withholding obligations does not exceed the maximum statutory tax rates in the applicable jurisdictions multiplied by the taxable income that arose from the option exercise, the Company's stock-based awards qualify for equity classification, as opposed to classification as a liability.
To determine the estimated fair value of stock options granted, the Company uses the Black-Scholes-Merton valuation formula, which is a closed-form model that uses an equation to estimate fair value. The following table sets forth the assumptions used to determine the fair value of the non-qualified stock options awarded to certain employees during fiscal years 2018, 2017 and 2016, which options vest over a two-year period, assuming continued service.
|
Stock Options Issued to Employees During Fiscal Years |
||||||||||||||||||||
| 2018 |
2017 |
2016 |
||||||||||||||||||
|
Number of options issued |
10,000 | 20,000 | 110,000 | 120,000 | 110,000 | |||||||||||||||
|
Grant date |
December 18, 2017 |
August 4, 2017 |
June 8, 2017 |
June 8, 2016 |
June 12, 2015 |
|||||||||||||||
|
Dividend yield |
4.92 | % | 5.77 | % | 4.13 | % | 3.33 | % | 3.82 | % | ||||||||||
|
Expected volatility |
25.00 | % | 25.00 | % | 25.00 | % | 20.00 | % | 20.00 | % | ||||||||||
|
Risk free interest rate |
1.94 | % | 1.51 | % | 1.47 | % | 0.93 | % | 1.12 | % | ||||||||||
|
Contractual term (years) |
10.00 | 10.00 | 10.00 | 10.00 | 10.00 | |||||||||||||||
|
Expected term (years) |
3.00 | 3.00 | 3.00 | 3.00 | 3.00 | |||||||||||||||
|
Forfeiture rate |
5.00 | % | 5.00 | % | 5.00 | % | 5.00 | % | 5.00 | % | ||||||||||
|
Exercise price (grant-date closing price) per option |
$ | 6.50 | $ | 5.55 | $ | 7.75 | $ | 9.60 | $ | 8.38 | ||||||||||
|
Fair value per option |
$ | 0.59 | $ | 0.50 | $ | 0.85 | $ | 0.94 | $ | 0.77 | ||||||||||
For the fiscal years ended April 1, 2018, April 2, 2017 and April 3, 2016, the Company recognized compensation expense associated with stock options as follows (in thousands):
| Fiscal Year Ended April 1, 2018 | ||||||||||||||||
|
Options Granted in Fiscal Year |
Cost of Products Sold |
Marketing & Administrative Expenses |
Total Expense |
|||||||||||||
|
2016 |
$ | 6 | $ | 1 | $ | 7 | ||||||||||
|
2017 |
26 | 15 | 41 | |||||||||||||
|
2018 |
17 | 19 | 36 | |||||||||||||
|
Total stock option compensation |
$ | 49 | $ | 35 | $ | 84 | ||||||||||
| Fiscal Year Ended April 2, 2017 | ||||||||||||
|
Cost of |
Marketing & |
|||||||||||
|
Products |
Administrative |
Total |
||||||||||
|
Options Granted in Fiscal Year |
Sold |
Expenses |
Expense |
|||||||||
|
2015 |
$ | 14 | $ | 12 | $ | 26 | ||||||
|
2016 |
23 | 19 | 42 | |||||||||
|
2017 |
25 | 17 | 42 | |||||||||
|
Total stock option compensation |
$ | 62 | $ | 48 | $ | 110 | ||||||
| Fiscal Year Ended April 3, 2016 | ||||||||||||
|
Cost of |
Marketing & |
|||||||||||
|
Products |
Administrative |
Total |
||||||||||
|
Options Granted in Fiscal Year |
Sold |
Expenses |
Expense |
|||||||||
|
2014 |
$ | 7 | $ | 7 | $ | 14 | ||||||
|
2015 |
54 | 45 | 99 | |||||||||
|
2016 |
17 | 14 | 31 | |||||||||
|
Total stock option compensation |
$ | 78 | $ | 66 | $ | 144 | ||||||
A summary of stock options outstanding and exercisable as of April 1, 2018 is as follows:
|
Exercise Price |
Number of Options Outstanding |
Weighted- Avg. Remaining Contractual Life in Years |
Weighted- Avg. Exercise Price of Options Outstanding |
Number of Options Exercisable |
Weighted- Avg. Exercise Price of Options Exercisable |
||||||||||||||||||
| $4.00 | - | 4.99 | 5,000 | 3.19 | $4.81 | 5,000 | $4.81 | ||||||||||||||||
| $5.00 | - | 5.99 | 40,000 | 6.77 | $5.49 | 20,000 | $5.42 | ||||||||||||||||
| $6.00 | - | 6.99 | 30,000 | 6.71 | $6.26 | 20,000 | $6.14 | ||||||||||||||||
| $7.00 | - | 7.99 | 160,000 | 8.07 | $7.81 | 60,000 | $7.90 | ||||||||||||||||
| $8.00 | - | 8.99 | 70,000 | 7.20 | $8.38 | 70,000 | $8.38 | ||||||||||||||||
| $9.00 | - | 9.99 | 90,000 | 8.19 | $9.60 | 45,000 | $9.60 | ||||||||||||||||
| 395,000 | 7.65 | $7.93 | 220,000 | $7.94 | |||||||||||||||||||
As of April 1, 2018, total unrecognized stock-option compensation costs amounted to $75,000, which will be recognized as the underlying stock options vest over a weighted-average period of 7.3 months. The amount of future stock-option compensation expense could be affected by any future stock option grants and by the separation from the Company of any employee or director who has stock options that are unvested as of such individual’s separation date.
Non-vested Stock Granted to Non-Employee Directors: The Board granted the following shares of non-vested stock to the Company’s non-employee directors:
|
Number |
Fair Value |
|||||
|
of Shares |
per Share |
Grant Date |
||||
| 28,000 | $5.50 |
August 9, 2017 |
||||
| 28,000 | 10.08 |
August 10, 2016 |
||||
| 28,000 | 8.20 |
August 12, 2015 |
||||
| 28,000 | 7.97 |
August 11, 2014 |
||||
| 28,000 | 6.67 |
August 14, 2013 |
||||
These shares vest over a two-year period, assuming continued service. The fair value of non-vested stock granted to the Company’s non-employee directors was based on the closing price of the Company’s common stock on the date of each grant. In each of August 2017, 2016 and 2015, 28,000 shares that had been granted to the Company’s non-employee directors vested, having an aggregate value of $157,000, $281,000 and $226,000, respectively.
Non-vested Stock Granted to Employees: During the three-month period ended June 27, 2010, the Board awarded 345,000 shares of non-vested stock to certain employees in a series of grants, each of which will vest only if (i) the closing price of the Company’s common stock is at or above certain target levels for any ten trading days out of any period of 30 consecutive trading days and (ii) the respective employees remain employed through July 29, 2015. The Company, with the assistance of an independent third party, determined that the aggregate grant date fair value of the awards amounted to $1.2 million.
With the closing price conditions having been met for these awards, the Board at various times approved the acceleration of the vesting of 105,000 shares from these grants. The vesting of these awards was accelerated in order to maximize the deductibility of the compensation expense associated with the grants by the Company for income tax purposes. On July 29, 2015, the remaining 240,000 of these shares vested, with such shares having an aggregate value of $1.9 million. Each of the individuals holding shares that vested surrendered to the Company the number of shares necessary to satisfy the income tax withholding obligations that arose from the vesting of the shares, and the Company remitted $948,000 to the appropriate taxing authorities on behalf of such individuals.
Performance Bonus Plan: The Company maintains a performance bonus plan for certain executive officers that provides for awards of cash or shares of common stock in the event that the aggregate average market value of the common stock during the relevant fiscal year, plus the amount of cash dividends paid in respect of the common stock during such period, increases. These individuals may instead be awarded cash, if and to the extent that an insufficient number of shares of common stock are available for issuance from all shareholder-approved, equity-based plans or programs of the Company in effect. The performance bonus plan also imposes individual limits on awards and provides that shares of common stock that may be awarded will vest over a two-year period. Thus, compensation expense associated with performance bonus plan awards are recognized over a three-year period – the fiscal year in which the award is earned, plus the two-year vesting period.
In connection with the performance bonus plan, the Company granted shares of common stock and recognized or will recognize compensation expense as set forth below.
|
Fiscal Year |
Shares |
Fiscal Year |
Fair Value Per |
Compensation expense recognized during fiscal year |
||||||||||||||||||||||||||||||||
|
Earned |
Granted |
Granted |
Share |
2014 |
2015 |
2016 |
2017 |
2018 |
2019 |
|||||||||||||||||||||||||||
|
2014 |
188,232 | 2015 | $ | 5.650 | $ | 354,000 | $ | 354,000 | $ | 354,000 | $ | - | $ | - | $ | - | ||||||||||||||||||||
|
2015 |
58,532 | 2016 | 7.180 | - | 140,000 | 140,000 | 140,000 | - | - | |||||||||||||||||||||||||||
|
2016 |
41,205 | 2017 | 7.865 | - | - | 108,000 | 108,000 | 108,000 | - | |||||||||||||||||||||||||||
|
2017 |
42,250 | 2018 | 8.271 | - | - | - | 116,000 | 116,000 | 116,000 | |||||||||||||||||||||||||||
The below table sets forth the vesting of shares issued in connection with the grants of shares set forth in the above table. Each of the individuals holding shares that vested surrendered to the Company the number of shares necessary to satisfy the income tax withholding obligations that arose from the vesting of the shares. The below table also sets forth the taxes remitted to the appropriate taxing authorities on behalf of such individuals.
|
Fiscal |
Vesting of shares during fiscal year 2016 |
Vesting of shares during fiscal year 2017 |
Vesting of shares during fiscal year 2018 |
|||||||||||||||||||||||||||||||||||||||
|
Year Granted |
Shares Granted |
Shares Vested |
Aggregate Value |
Taxes Remitted |
Shares Vested |
Aggregate Value |
Taxes Remitted |
Shares Vested |
Aggregate Value |
Taxes Remitted |
||||||||||||||||||||||||||||||||
|
2015 |
188,232 | 188,532 | $ | 1,618,000 | $ | 789,000 | - | $ | - | $ | - | - | $ | - | $ | - | ||||||||||||||||||||||||||
|
2016 |
58,532 | 29,267 | 275,000 | 138,000 | 29,265 | 240,000 | 86,000 | - | - | - | ||||||||||||||||||||||||||||||||
|
2017 |
41,205 | - | - | - | - | - | - | 20,604 | 167,000 | 56,000 | ||||||||||||||||||||||||||||||||
For the fiscal years ended April 1, 2018, April 2, 2017 and April 3, 2016, the Company recognized compensation expense associated with non-vested stock grants, which is included in marketing and administrative expenses in the accompanying consolidated statements of income, as follows (in thousands):
| Fiscal Year Ended April 1, 2018 | ||||||||||||
|
Non-employee |
Total |
|||||||||||
|
Stock Granted in Fiscal Year |
Employees |
Directors |
Expense |
|||||||||
|
2016 |
$ | - | $ | 38 | $ | 38 | ||||||
|
2017 |
108 | 141 | 249 | |||||||||
|
2018 |
116 | 52 | 168 | |||||||||
|
Total stock grant compensation |
$ | 224 | $ | 231 | $ | 455 | ||||||
| Fiscal Year Ended April 2, 2017 | ||||||||||||
|
Non-employee |
Total |
|||||||||||
|
Stock Granted in Fiscal Year |
Employees |
Directors |
Expense |
|||||||||
|
2015 |
$ | - | $ | 37 | $ | 37 | ||||||
|
2016 |
140 | 115 | 255 | |||||||||
|
2017 |
108 | 94 | 202 | |||||||||
|
Total stock grant compensation |
$ | 248 | $ | 246 | $ | 494 | ||||||
| Fiscal Year Ended April 3, 2016 | ||||||||||||
|
Non-employee |
Total |
|||||||||||
|
Stock Granted in Fiscal Year |
Employees |
Directors |
Expense |
|||||||||
|
2011 |
$ | 49 | $ | - | $ | 49 | ||||||
|
2014 |
- | 31 | 31 | |||||||||
|
2015 |
354 | 112 | 466 | |||||||||
|
2016 |
140 | 76 | 216 | |||||||||
|
Total stock grant compensation |
$ | 543 | $ | 219 | $ | 762 | ||||||
As of April 1, 2018, total unrecognized compensation expense related to the Company’s non-vested stock grants was $266,000, which will be recognized over the remaining portion of the respective vesting periods associated with each block of grants, such grants having a weighted average vesting term of 5.7 months. The amount of future compensation expense related to non-vested stock grants could be affected by any future non-vested stock grants and by the separation from the Company of any individual who has unvested grants as of such individual’s separation date.
Note 9 – Income Taxes
The Company’s income tax provision for the fiscal years ended April 1, 2018, April 2, 2017 and April 3, 2016 is summarized below (in thousands):
| Fiscal Year Ended April 1, 2018 | ||||||||||||
|
Current |
Deferred |
Total |
||||||||||
|
Income tax expense on current year income: |
||||||||||||
|
Federal |
$ | 1,219 | $ | 325 | $ | 1,544 | ||||||
|
State |
177 | 41 | 218 | |||||||||
|
Foreign |
12 | - | 12 | |||||||||
|
Total income tax expense on current year income |
1,408 | 366 | 1,774 | |||||||||
|
Income tax expense (benefit) - discrete items: |
||||||||||||
|
Reserve for unrecognized tax benefits |
113 | - | 113 | |||||||||
|
Revaluations due to change in enacted tax rates |
120 | 377 | 497 | |||||||||
|
Adjustment to prior year provision |
74 | (35 | ) | 39 | ||||||||
|
Net excess tax benefit related to stock-based compensation |
(23 | ) | - | (23 | ) | |||||||
|
Income tax expense - discrete items |
284 | 342 | 626 | |||||||||
|
Total income tax expense |
$ | 1,692 | $ | 708 | $ | 2,400 | ||||||
| Fiscal Year Ended April 2, 2017 | ||||||||||||
|
Current |
Deferred |
Total |
||||||||||
|
Income tax expense on current year income: |
||||||||||||
|
Federal |
$ | 2,422 | $ | 588 | $ | 3,010 | ||||||
|
State |
200 | 105 | 305 | |||||||||
|
Foreign |
10 | - | 10 | |||||||||
|
Total income tax expense on current year income |
2,632 | 693 | 3,325 | |||||||||
|
Income tax expense (benefit) - discrete items: |
||||||||||||
|
Reserve for unrecognized tax benefits |
134 | - | 134 | |||||||||
|
Adjustment to prior year provision |
9 | 4 | 13 | |||||||||
|
Net excess tax benefit related to stock-based compensation |
(248 | ) | - | (248 | ) | |||||||
|
Income tax expense (benefit) - discrete items |
(105 | ) | 4 | (101 | ) | |||||||
|
Total income tax expense |
$ | 2,527 | $ | 697 | $ | 3,224 | ||||||
| Fiscal Year Ended April 2, 2017 | ||||||||||||
|
Current |
Deferred |
Total |
||||||||||
|
Federal |
$ | 3,540 | $ | 133 | $ | 3,673 | ||||||
|
State |
271 | 32 | 303 | |||||||||
|
Other -- net, including foreign |
(61 | ) | - | (61 | ) | |||||||
|
Income tax expense |
3,750 | 165 | 3,915 | |||||||||
|
Income tax reported in shareholders' equity related to stock-based compensation |
(273 | ) | - | (273 | ) | |||||||
|
Total |
$ | 3,477 | $ | 165 | $ | 3,642 | ||||||
The tax effects of temporary differences that give rise to significant portions of the deferred tax assets and deferred tax liabilities as of April 1, 2018 and April 2, 2017 are as follows (in thousands):
|
April 1, 2018 |
April 2, 2017 |
|||||||
|
Deferred tax assets: |
||||||||
|
Employee wage and benefit accruals |
$ | 233 | $ | 319 | ||||
|
Accounts receivable and inventory reserves |
180 | 301 | ||||||
|
Deferred rent |
40 | 67 | ||||||
|
Intangible assets |
391 | 590 | ||||||
|
State net operating loss carryforwards |
724 | 829 | ||||||
|
Stock-based compensation |
208 | 299 | ||||||
|
Total gross deferred tax assets |
1,776 | 2,405 | ||||||
|
Less valuation allowance |
(724 | ) | (829 | ) | ||||
|
Deferred tax assets after valuation allowance |
1,052 | 1,576 | ||||||
|
Deferred tax liabilities: |
||||||||
|
Prepaid expenses |
(186 | ) | (265 | ) | ||||
|
Property, plant and equipment |
(334 | ) | (71 | ) | ||||
|
Total deferred tax liabilities |
(520 | ) | (336 | ) | ||||
|
Net deferred income tax assets |
$ | 532 | $ | 1,240 | ||||
In assessing the probability that the Company’s deferred tax assets will be realized, management of the Company has considered whether it is more likely than not that some portion or all of the deferred tax assets will not be realized. The ultimate realization of deferred tax assets is dependent upon the generation of taxable income during the future periods in which the temporary differences giving rise to the deferred tax assets will become deductible. The Company has also considered the scheduled inclusion into taxable income in future periods of the temporary differences giving rise to the Company’s deferred tax liabilities. The valuation allowance as of April 1, 2018 and April 2, 2017 was related to state net operating loss carryforwards that the Company does not expect to be realized. Based upon the Company’s expectations of the generation of sufficient taxable income during future periods, the Company believes that it is more likely than not that the Company will realize its deferred tax assets, net of the valuation allowance and the deferred tax liabilities.
The Company’s policy is to recognize the effect that a change in enacted tax rates would have on net deferred income tax assets and liabilities in the period in which the tax rates are changed. On December 22, 2017, the President of the United States signed into law the TCJA, which includes a provision to lower the federal corporate income tax rate to 21% effective as of January 1, 2018. As the Company’s fiscal year 2018 ended on April 1, 2018, the lower corporate income tax rate was phased in, resulting in a blended federal statutory rate of 30.75% for fiscal year 2018.
The Company’s policy is to provide for deferred income taxes based on the difference between the financial statement and tax bases of assets and liabilities using enacted tax rates that will be in effect when the differences are expected to reverse. The Company has recognized the effect of the TCJA on the Company’s net deferred income tax assets, which as of October 2, 2017 and April 2, 2017 had been recorded based upon the pre-TCJA enacted composite federal, state and foreign income tax rate of approximately 37.5% that would have been applied as the financial statement and tax differences began to reverse. Because most of these differences are now estimated to reverse at a composite rate of approximately 24.5%, the Company was required to revalue its net deferred income tax assets. This revaluation resulted in a discrete charge to income tax expense of $377,000 during fiscal year 2018.
Management evaluates items of income, deductions and credits reported on the Company’s various federal and state income tax returns filed and recognizes the effect of positions taken on those income tax returns only if those positions are more likely than not to be sustained. The Company applies the provisions of FASB ASC Sub-topic 740-10-25, which requires a minimum recognition threshold that a tax benefit must meet before being recognized in the financial statements. Recognized income tax positions are measured at the largest amount that has a greater than 50% likelihood of being realized. Changes in recognition or measurement are reflected in the period in which the change in judgment occurs.
The following table sets forth the reconciliation of the beginning and ending amounts of unrecognized tax benefits for fiscal years 2018, 2017 and 2016 (in thousands):
|
2018 |
2017 |
2016 |
||||||||||
|
Balance at beginning of period |
$ | 688 | $ | 211 | $ | - | ||||||
|
Additions related to current year positions |
113 | 134 | 195 | |||||||||
|
Additions related to prior year positions |
96 | 343 | 16 | |||||||||
|
Revaluations due to change in enacted tax rates |
120 | - | - | |||||||||
|
Reductions for tax positions of prior years |
- | - | - | |||||||||
|
Reductions due to the lapse of the statute of limitations |
- | - | - | |||||||||
|
Payments pursuant to judgements and settlements |
- | - | - | |||||||||
|
Balance at end of period |
$ | 1,017 | $ | 688 | $ | 211 | ||||||
During fiscal year 2016, an evaluation was made of the Company’s process regarding the calculation of the state portion of its income tax provision. This evaluation resulted in a tax position that reflects opportunities for the application of more favorable state apportionment percentages for several prior fiscal years. After considering all relevant information, the Company believes that the technical merits of this tax position would more likely than not be sustained. However, the Company also believes that the ultimate resolution of the tax position will result in a tax benefit that is less than the full amount being sought. Therefore, the Company’s measurement regarding the tax impact of the revised state apportionment percentages resulted in the Company recording during fiscal years 2018 and 2017 reserves for unrecognized tax benefits of $113,000 and $134,000, respectively, in the accompanying consolidated financial statements. During fiscal year 2016, the Company recorded a gross reserve for unrecognized tax benefits of $773,000, less an offset of $573,000 to reflect state income tax overpayments net of the federal income tax impact, for a net reserve for unrecognized tax benefits of $200,000. Because the tax impact of the revised state apportionment percentages are measured net of federal income taxes, the provision in the TCJA that lowered the federal corporate income tax rate to 21% required the Company to revalue its reserve for unrecognized tax benefits. This revaluation resulted in a net discrete charge to income tax expense of $120,000 during fiscal year 2018.
The Company’s policy is to accrue interest expense and penalties as appropriate on any estimated unrecognized tax benefits as a charge to interest expense in the Company’s consolidated statements of income. During fiscal years 2018, 2017 and 2016, the Company accrued $96,000, $65,000 and $11,000, respectively, for interest expense and penalties on the portion of the unrecognized tax benefit that has been refunded to the Company but for which the relevant statute of limitations remained unexpired. No interest expense or penalties are accrued with respect to estimated unrecognized tax benefits that are associated with state income tax overpayments that remain receivable.
The Company's provision for income taxes is based upon effective tax rates of 44.3%, 36.7% and 36.4% in fiscal years 2018, 2017 and 2016, respectively. These effective tax rates are the sum of the top U.S. statutory federal income tax rate and a composite rate for state income taxes, net of federal tax benefit, in the various states in which the Company operates, plus the net effect of various discrete items.
The following table reconciles income tax expense on income from continuing operations at the U.S. federal income tax statutory rate to the net income tax provision reported for fiscal years 2018, 2017 and 2016 (in thousands):
|
2018 |
2017 |
2016 |
||||||||||
|
Federal statutory rate |
30.75 | % | 34.00 | % | 34.00 | % | ||||||
|
Tax expense at federal statutory rate |
$ | 1,662 | $ | 2,991 | $ | 3,653 | ||||||
|
State income taxes, net of Federal income tax benefit |
126 | 201 | 200 | |||||||||
|
Tax credits |
(12 | ) | (10 | ) | (13 | ) | ||||||
|
Discrete items |
626 | (105 | ) | - | ||||||||
|
Net tax effect of book expenses not deductible for tax purposes |
- | 143 | 132 | |||||||||
|
Other - net, including foreign |
(2 | ) | 4 | (57 | ) | |||||||
|
Income tax expense |
$ | 2,400 | $ | 3,224 | $ | 3,915 | ||||||
Note 10 – Shareholders’ Equity
Dividends: The holders of shares of the Company’s common stock are entitled to receive dividends when and as declared by the Board. Aggregate cash dividends of $0.32, $0.72 and $0.57 per share, amounting to $3.2 million, $7.2 million and $5.7 million, were declared during fiscal years 2018, 2017 and 2016, respectively. The dividends declared during fiscal years 2017 and 2016 included special cash dividends of $0.40 and $0.25 per share, respectively. The Company’s financing agreement with CIT permits the payment by the Company of cash dividends on its common stock without limitation, provided there is no default before or as a result of the payment of such dividends.
Stock Repurchases: The Company acquired treasury shares by way of the surrender to the Company from several employees shares of common stock to satisfy the exercise price and income tax withholding obligations relating to the exercise of stock options and the vesting of stock. In this manner, the Company acquired 7,000 treasury shares during the fiscal year ended April 1, 2018 at a weighted-average market value of $8.10 per share, acquired 99,000 treasury shares during the fiscal year ended April 2, 2017 at a weighted-average market value of $9.58 per share and acquired 337,000 treasury shares during the fiscal year ended April 3, 2016 at a weighted-average market value of $8.41 per share.
Note 11 - Major Customers
The table below sets forth those customers that represented more than 10% of the Company’s gross sales during fiscal years ended April 1, 2018, April 2, 2017 and April 3, 2016.
|
2018 |
2017 |
2016 |
||||||||||
|
Walmart Inc. |
39% | 42% | 42% | |||||||||
|
Toys "R" Us, Inc. |
15% | 19% | 23% | |||||||||
|
Amazon.com, Inc. |
11% | * | * | |||||||||
| * Amount represented less than 10% of the Company's gross sales for this fiscal year. | ||||||||||||
Note 12 – Commitments and Contingencies
Total rent expense was $1.6 million, $1.5 million and $1.5 million during fiscal years 2018 2017 and 2016, respectively. The Company’s commitment for minimum guaranteed rental payments under its lease agreements as of April 1, 2018 is $3.3 million, consisting of $1.5 million, $1.4 million and $473,000 due in fiscal years 2019, 2020 and 2021, respectively.
Total royalty expense was $7.2 million, $7.0 million, and $9.0 million for fiscal years 2018, 2017 and 2016, respectively. The Company’s commitment for minimum guaranteed royalty payments under its license agreements as of April 1, 2018 is $4.4 million, consisting of $2.9 million and $1.5 million due in fiscal years 2019 and 2020, respectively.
The Company is, from time to time, involved in various legal proceedings relating to claims arising in the ordinary course of its business. Neither the Company nor any of its subsidiaries is a party to any such legal proceeding the outcome of which, individually or in the aggregate, is expected to have a material adverse effect on the Company’s financial position, results of operations or cash flows.
Note 13 – Related Party Transaction
On August 4, 2017, Carousel entered into a lease of the Carousel facilities with JST Capital, LLC (“JST”), a wholly-owned subsidiary of Pritech, Inc., which is owned by the Chief Executive Officer and President of Carousel. Carousel made lease payments of $63,000 to JST during fiscal year 2018, $55,000 of which was included in cost of products sold and $8,000 of which was included in marketing and administrative expenses in the accompanying consolidated statements of income.
Note 14 – Subsequent Events
The Company has evaluated events that have occurred between April 1, 2018 and the date that the accompanying financial statements were issued, and has determined that there are no material subsequent events that require disclosure.
F-25